As education costs continue to rise, student loans are the only source for many students to pursue higher education.
Currently, 43.2 million U.S. students have borrowed student loans worth $1.73 trillion.
The students who completed their courses owe most student loans, and female students are more likely to take out loans than male students.
This article will cover some essential statistics about student loan debt, loan borrowers, loan repayment, and forgiveness programs.
Student Loan Statistics 2024: Top Highlights
- Americans owe $1.73 trillion worth of student loan debt.
- The average student loan debt is around $37,088.
- Federal student loan debt was estimated at $1.63 trillion in 2022.
- Private student loan debt was around $122.70 billion in 2022.
- 62% of student loans in the U.S. were in forbearance in 2023.
- An average of $63,826 per borrower was forgiven through the Public Service Loan Forgiveness program.
Student Loan Debt Statistics
College tuition expenses have only increased with time, and students take out loans to pursue higher education.
Student loan debt is a convenient way for students to get degrees without paying the fees beforehand.
However, the bigger loan amounts have become a major reason for students to drop out of institutes without completing their program.
The Student Loan Debt In The United States Amounts To $1.73 Trillion
In 2022, the total student loan debt in the U.S. was around $1.76 trillion, which decreased by 2.09% in 2023.
The total amount of student loan debt in the U.S. has declined since the third quarter of 2023.
Around $1.74 trillion was given to students in the form of student loans in the year 2021.
Here is a table showing the total student loan debt in the U.S. over the years:
| Year | Total Student Loan Debt | YoY Change |
|---|---|---|
| Q4 2023 | $1.727 trillion | -2.09% |
| Q3 2023 | $1.732 trillion | -1.66% |
| Q2 2023 | $1.761 trillion | 0.99% |
| Q1 2023 | $1.774 trillion | 1.57% |
| Q4 2022 | $1.764 trillion | 1.28% |
| Q3 2022 | $1.761 trillion | 1.28% |
| Q2 2022 | $1.744 trillion | 1.45% |
| Q1 2022 | $1.747 trillion | 1.67% |
| Q4 2021 | $1.733 trillion | 2.34% |
| Q3 2021 | $1.739 trillion | 2.53% |
| Q2 2021 | $1.719 trillion | 2.78% |
| Q1 2021 | $1.718 trillion | 2.80% |
| Q4 2020 | $1.693 trillion | 3.42% |
| Q3 2020 | $1.696 trillion | 3.75% |
| Q2 2020 | $1.672 trillion | 4.32% |
| Q1 2020 | $1.671 trillion | 4.65% |
Source: Education Data
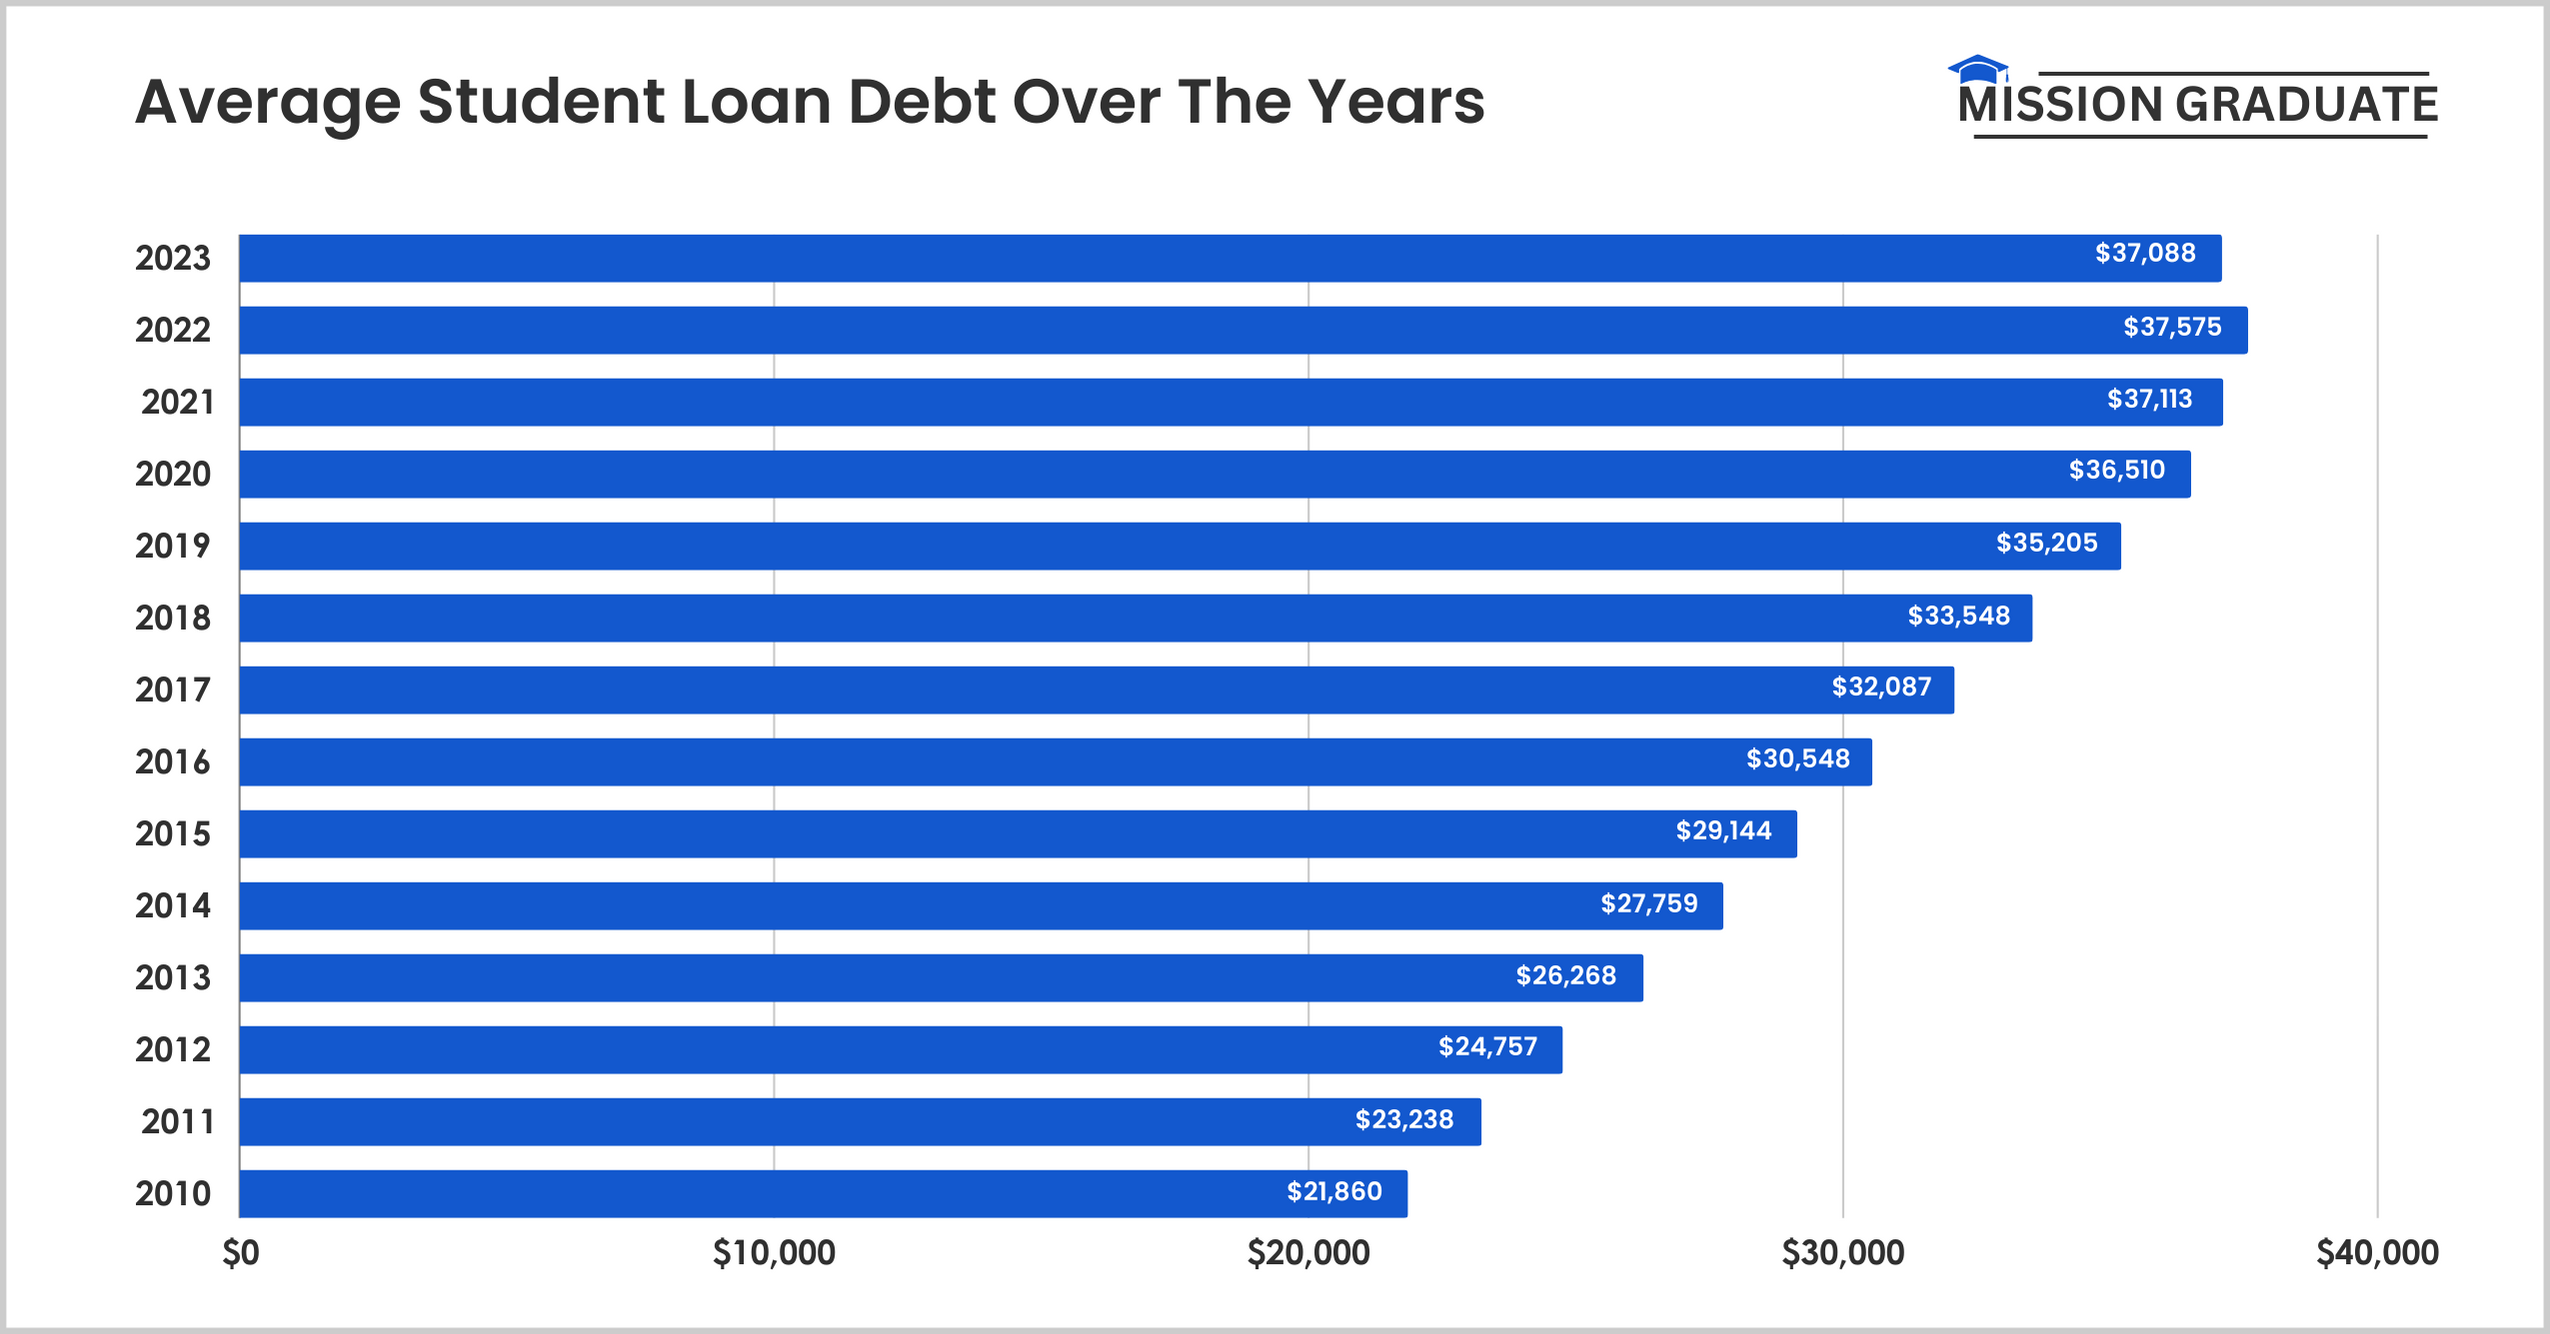
The Average Student Loan Debt Is Around $37,088 In The U.S.
The average student loan debt has consistently risen over the past decades.
In 2020, the average student loan debt was around $36,510, which peaked in 2022, reaching over $37,575.
The average student loan debt in the U.S. has increased by over $10,820 between 2013 and 2023.

The table shows the average student loan debt in the United States over the years:
| Year | Average Student Loan Debt |
|---|---|
| 2023 | $37,088 |
| 2022 | $37,575 |
| 2021 | $37,113 |
| 2020 | $36,510 |
| 2019 | $35,205 |
| 2018 | $33,548 |
| 2017 | $32,087 |
| 2016 | $30,548 |
| 2015 | $29,144 |
| 2014 | $27,759 |
| 2013 | $26,268 |
| 2012 | $24,757 |
| 2011 | $23,238 |
| 2010 | $21,860 |
Source: Best Colleges
Federal Student Loan Debt Amounted To Around $1.63 Trillion In 2022
On the other hand, the private student loan debt was around $122.70 billion in 2022.
$1.61 trillion was given as federal student loan debt in 2021, while private student loan debt was around $122.70 billion.
In 2020, nearly $1.56 trillion in federal student loan debt was given to students, and $127.60 billion was private student loan debt.
Here is a table showing the distribution of student loan debt by federal and private student loan over the years:
| Year | Federal Student Loan Debt | Private Student Loan Debt |
|---|---|---|
| 2022 | $1.634 trillion | $122.70 billion |
| 2021 | $1.610 trillion | $122.70 billion |
| 2020 | $1.566 trillion | $127.60 billion |
| 2019 | $1.510 trillion | $127.6 billion |
| 2018 | $1.439 trillion | $127.70 billion |
Source: Education Data
9.5 Million U.S. Students Have A Loan Valued Between $10,000 To $20,000
As of July 2023, about 10 million students in the United States have student loan debt of $20,000 to $40,000.
2.5 million students have $100,000 to $200,000 in student loan debt, while 1 million have loans over $200,000.
Furthermore, 7 million students have a loan balance of less than $5,000 in the U.S.
Here is a table showing the number of student loan borrowers by loan amount in the United States:
| Student Loan Balance | Number Of Students |
|---|---|
| Less than $5,000 | 7 million |
| $5,000 to $10,000 | 7.8 million |
| $10,000 to $20,000 | 9.5 million |
| $20,000 to $40,000 | 10 million |
| $40,000 to $60,000 | 4.4 million |
| $60,000 to $80,000 | 2.6 million |
| $80,000 to $100,000 | 1.4 million |
| $100,000 to $200,000 | 2.5 million |
| More than $200,000 | 1 million |
Source: Statista
24% Of U.S. Students Borrowed Student Loans In The Academic Year 2022- 2023
This was a 2% increase from the academic year 2021-22. Around 22% of U.S. students took student loans in the academic year 2021-22.
In the academic year 2017- 18, 35% of college students borrowed federal loans. This was the highest percentage of students taking federal loans over the years.
During the pandemic, 27% of U.S. students took federal loans, a 3% increase from the pre-pandemic year 2019-20.
Here is a table showing the percentage of U.S. college students who took federal loans over the years:
| Academic Year | Percentage Of College Students |
|---|---|
| 2022 – 23 | 24% |
| 2021 – 22 | 22% |
| 2020 – 21 | 27% |
| 2019 – 20 | 30% |
| 2018 – 19 | 35% |
| 2017 – 18 | 31% |
| 2016 – 17 | 33% |
| 2015 – 16 | 25% |
| 2014 – 15 | 30% |
| 2013 – 14 | 28% |
| 2012 – 13 | 29% |
| 2011 – 12 | 34% |
Source: Statista
$15.26 Billion Were Distributed Via The Subsidized Stafford Loan Program During 2022-23 In The United States
In that same year, $43.67 billion was given to students through the Unsubsidized Stafford, and $11.24 billion was given through the Parent PLUS program.
In 2021-22, around $47.85 billion was disbursed through the Unsubsidized Stafford program, and $16.96 billion was disbursed via the Subsidized Stafford program.
Here is a table showing the total loan amount disbursed by various loan programs in the United States:
| Year | Subsidized Stafford | Unsubsidized Stafford | Parent PLUS | Grad PLUS |
|---|---|---|---|---|
| 2022 – 23 | $15.25 billion | $43.67 billion | $11.24 billion | $13.28 billion |
| 2021 – 22 | $16.96 billion | $47.85 billion | $11.27 billion | $13.52 billion |
| 2020 – 21 | $18.72 billion | $52.37 billion | $11.35 billion | $13.29 billion |
| 2019 – 20 | $21.56 billion | $54.51 billion | $14.14 billion | $12.84 billion |
| 2018 – 19 | $23.09 billion | $55.84 billion | $14.90 billion | $12.51 billion |
| 2017 – 18 | $24.96 billion | $58.22 billion | $15.21 billion | $12.29 billion |
Source: Statista
Student Loan Debt By State
The federal student loan debt in the United States has almost tripled in the past 10 to 15 years.
The average federal student loan debt in the U.S. is about $37,090, and states like DC and Maryland have the highest average student debt.
This section will cover the statistics about student loan debt by states in the U.S.
The District of Columbia Has The Highest Average Student Loan Debt, At Roughly $53,780
Maryland comes in second with an average student loan debt of around $42,280.
Florida has an average of about $38,060 in student loan debt, while New York has an average debt of around $37,430.
California students have an average debt of around $36,890, and Vermont has an average student loan debt of $36,990.
Here is a table showing the top 15 states with the highest student loan debt in the United States:
| Number | State | Average Student Loan Debt |
|---|---|---|
| 1. | District of Columbia | $53,780 |
| 2. | Maryland | $42,280 |
| 3. | Georgia | $40,800 |
| 4. | Virginia | $38,900 |
| 5. | Florida | $38,060 |
| 6. | Illinois | $37,640 |
| 7. | South Carolina | $37,550 |
| 8. | North Carolina | $37,490 |
| 9. | New York | $37,430 |
| 10. | Delaware | $37,340 |
| 11. | Vermont | $36,990 |
| 12. | Oregon | $36,990 |
| 13. | Hawaii | $36,920 |
| 14. | California | $36,890 |
| 15. | Alabama | $36,590 |
Source: Best Colleges
North Dakota Has The Lowest Average Student Loan Debt Of Approximately $28,920
The state of Iowa has an average loan debt of around $29,940. This represents a difference of around $7,148 from the national average.
South Dakota has an average student debt of $29,980, and Texas students have an average of $32,720 in student loan debt.
Here is a table showing the top 15 states with the lowest student loan debt in the United States:
| Number | State | Average Student Loan Debt |
|---|---|---|
| 1. | North Dakota | $28,920 |
| 2. | Iowa | $29,940 |
| 3. | South Dakota | $29,980 |
| 4. | Puerto Rico | $30,000 |
| 5. | Wyoming | $30,360 |
| 6. | Oklahoma | $31,180 |
| 7. | West Virginia | $31,260 |
| 8. | Nebraska | $31,340 |
| 9. | Wisconsin | $31,680 |
| 10. | Kansas | $32,160 |
| 11. | Indiana | $32,210 |
| 12. | Rhode Island | $32,320 |
| 13. | Idaho | $32,400 |
| 14. | Kentucky | $32,610 |
| 15. | Texas | $32,720 |
Source: Best Colleges
Student Loan Borrowers Statistics
Student loan borrowers or students are diverse and come from all races and ethnicities.
The majority of borrowers are students who have already completed their college courses.
Let us explore the statistics regarding the demographics of student loan borrowers.
47% Of Females Have Borrowed Student Loans Compared To 40% Of Males
Women are more likely to take student loans than men, while men pay back the debt faster than women.
Half of the Black adults in the U.S. have borrowed student loans, and 37% of Hispanics or Latinos were likely to take student loans.
White men have an average student debt of around $7,700, and white women have an average student debt of $9,600.
Here is a table showing the average student debt by gender and race:
| Student | Average Student Loan Debt |
|---|---|
| White men | $7,700 |
| White women | $9,600 |
| Hispanic men | $7,400 |
| Hispanic women | $6,700 |
| Black men | $7,900 |
| Black women | $11,000 |
Source: St. Louis Federal Reserve Bank
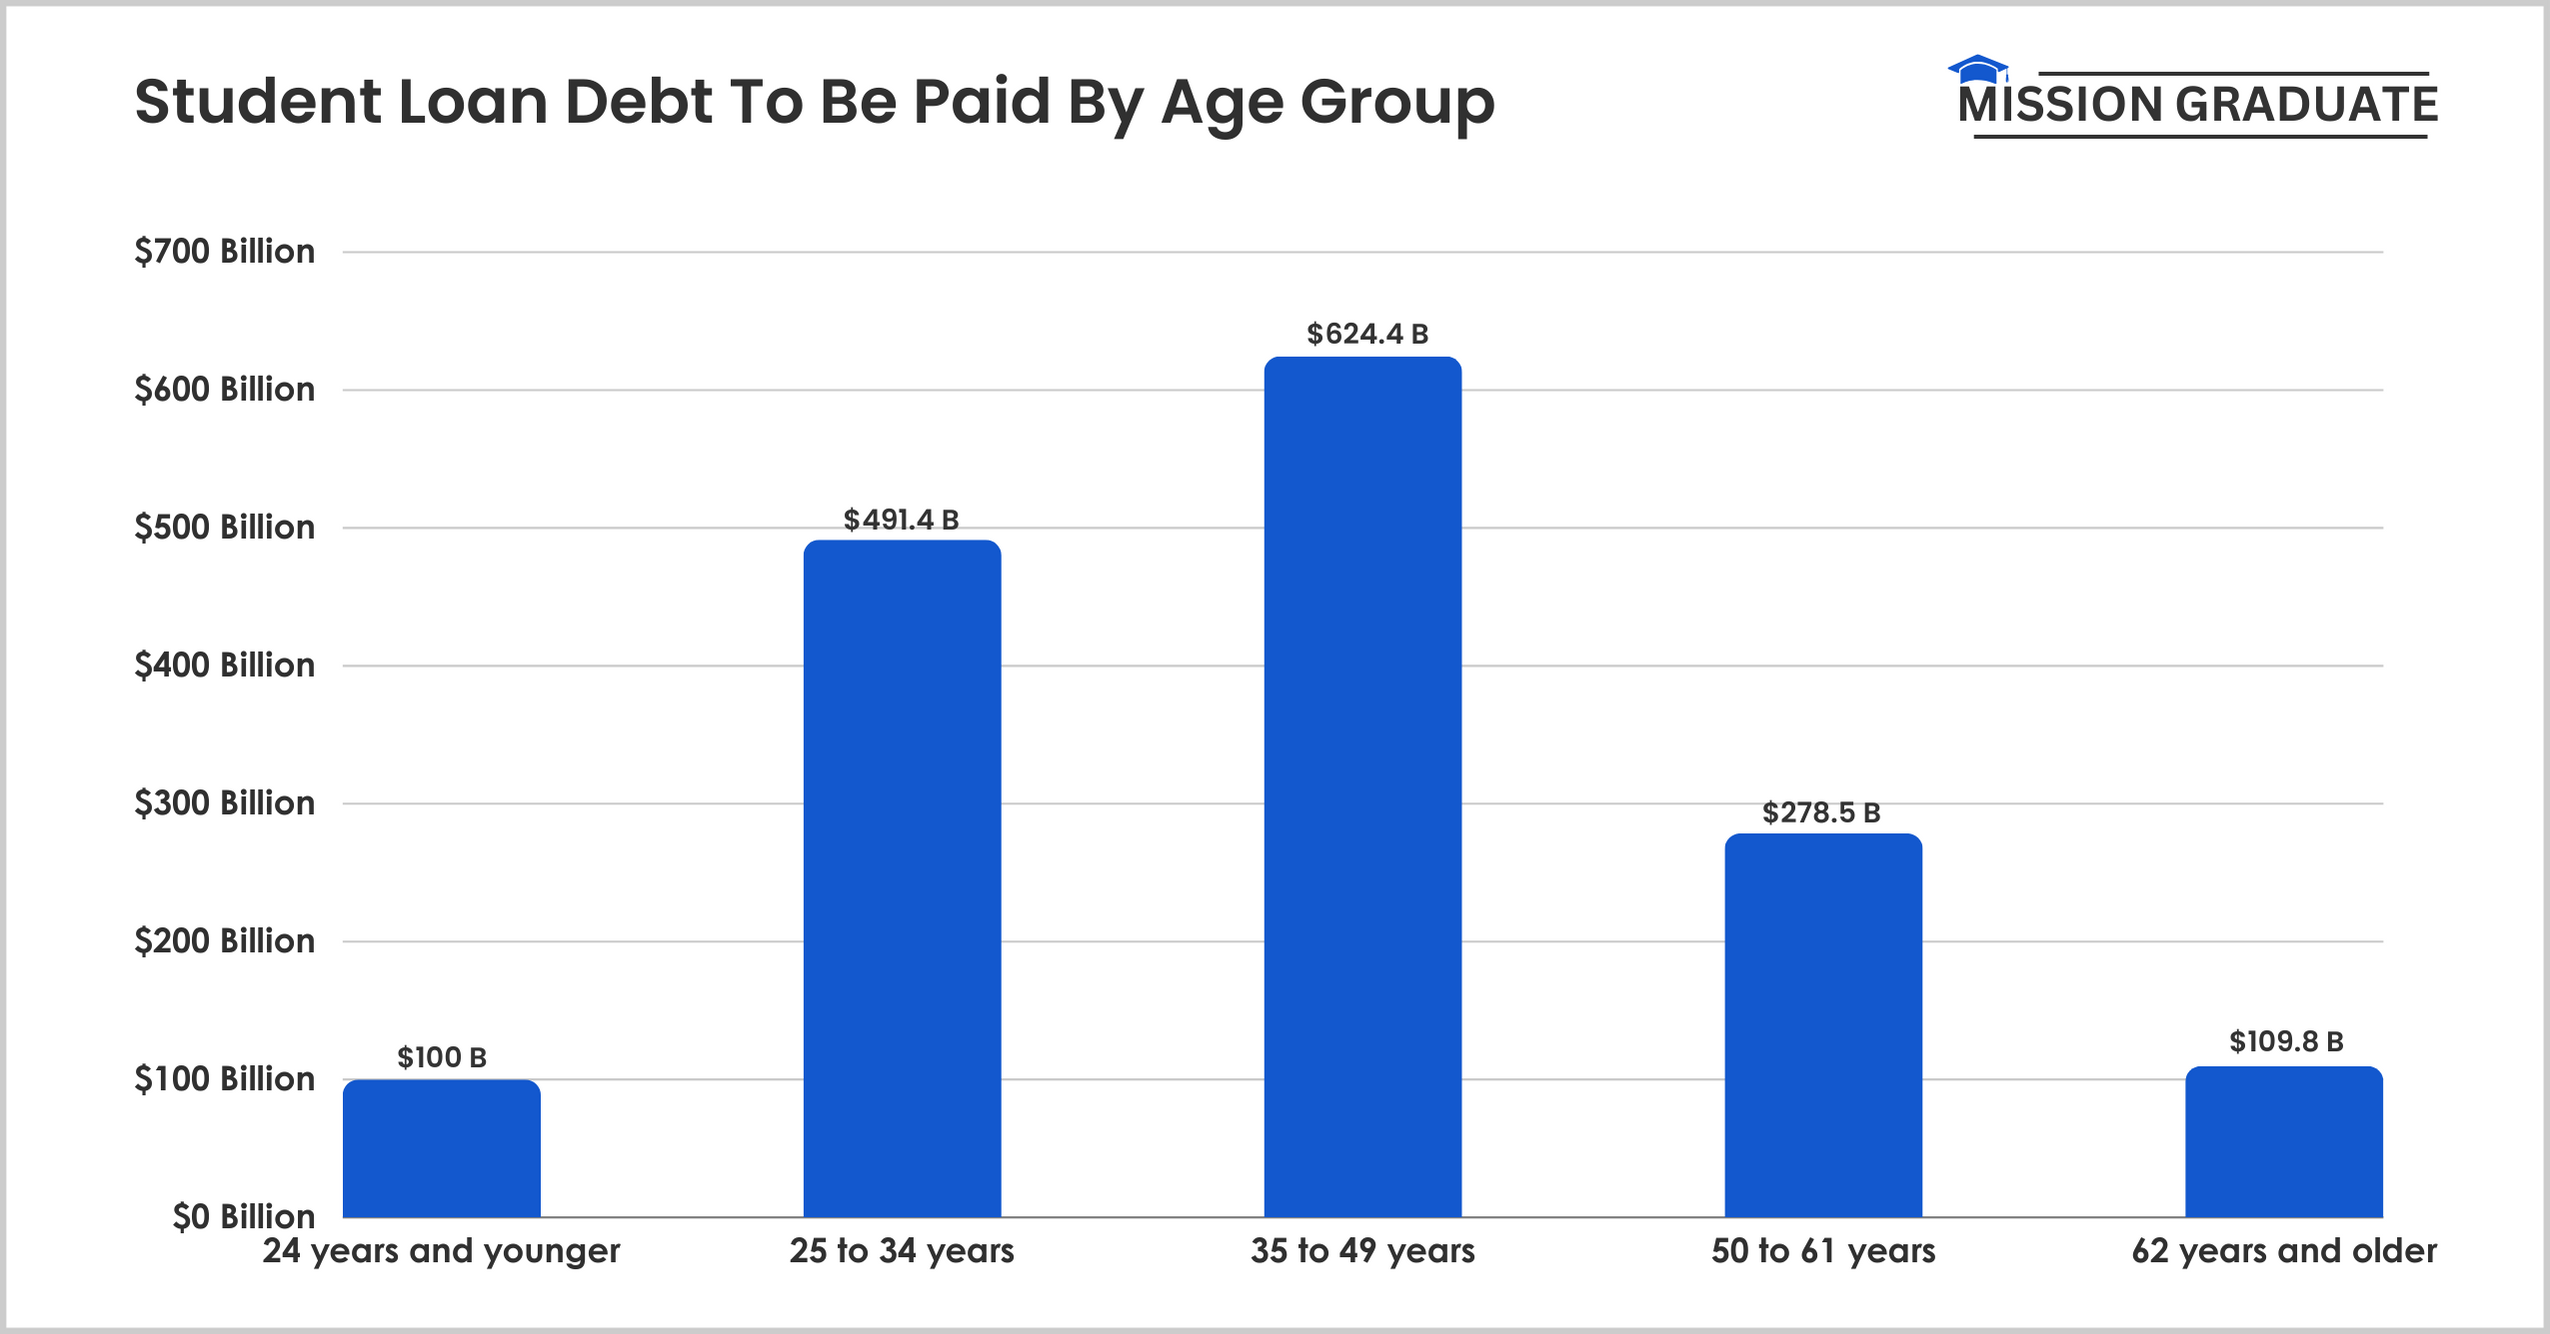
People Aged Between 35 And 49 Years Have Student Debt Of $624.4 Billion
This age group represents the largest total outstanding debt in the U.S.
On the other hand, people aged 25 to 34 years have student loan debt of about $491.4 billion.
Further, adults aged between 50 and 61 years have a total outstanding debt of $278.5 billion.

Here is a table showing the student loan debt of federal student loan borrowers in the United States by age group:
| Age Group | Student Loan Debt To Be Paid |
|---|---|
| 24 years and younger | $100 billion |
| 25 to 34 years | $491.4 billion |
| 35 to 49 years | $624.4 billion |
| 50 to 61 years | $278.5 billion |
| 62 years and older | $109.8 billion |
Source: Statista
Borrowers Aged 25 To 34 Have An Average Loan Debt Per Borrower Of $32,707.48
With an average loan balance of $49,375 per borrower, U.S. citizens over the age of 62 had the highest average student loan debt across all age groups.
U.S. citizens aged between 35 and 49 years have an average student loan balance of $44,441.67 per borrower.
Students aged 24 and younger have the lowest loan debt per borrower, averaging $13,722.22.
Source: Statista
Student Loan Debt Repayment Statistics
Student loans play an important role in many students’ completing education.
However, many borrowers face significant difficulties in repaying these loans, which affects their financial well-being and shapes their future financial decisions.
Let’s explore some statistics about student loan debt repayment.
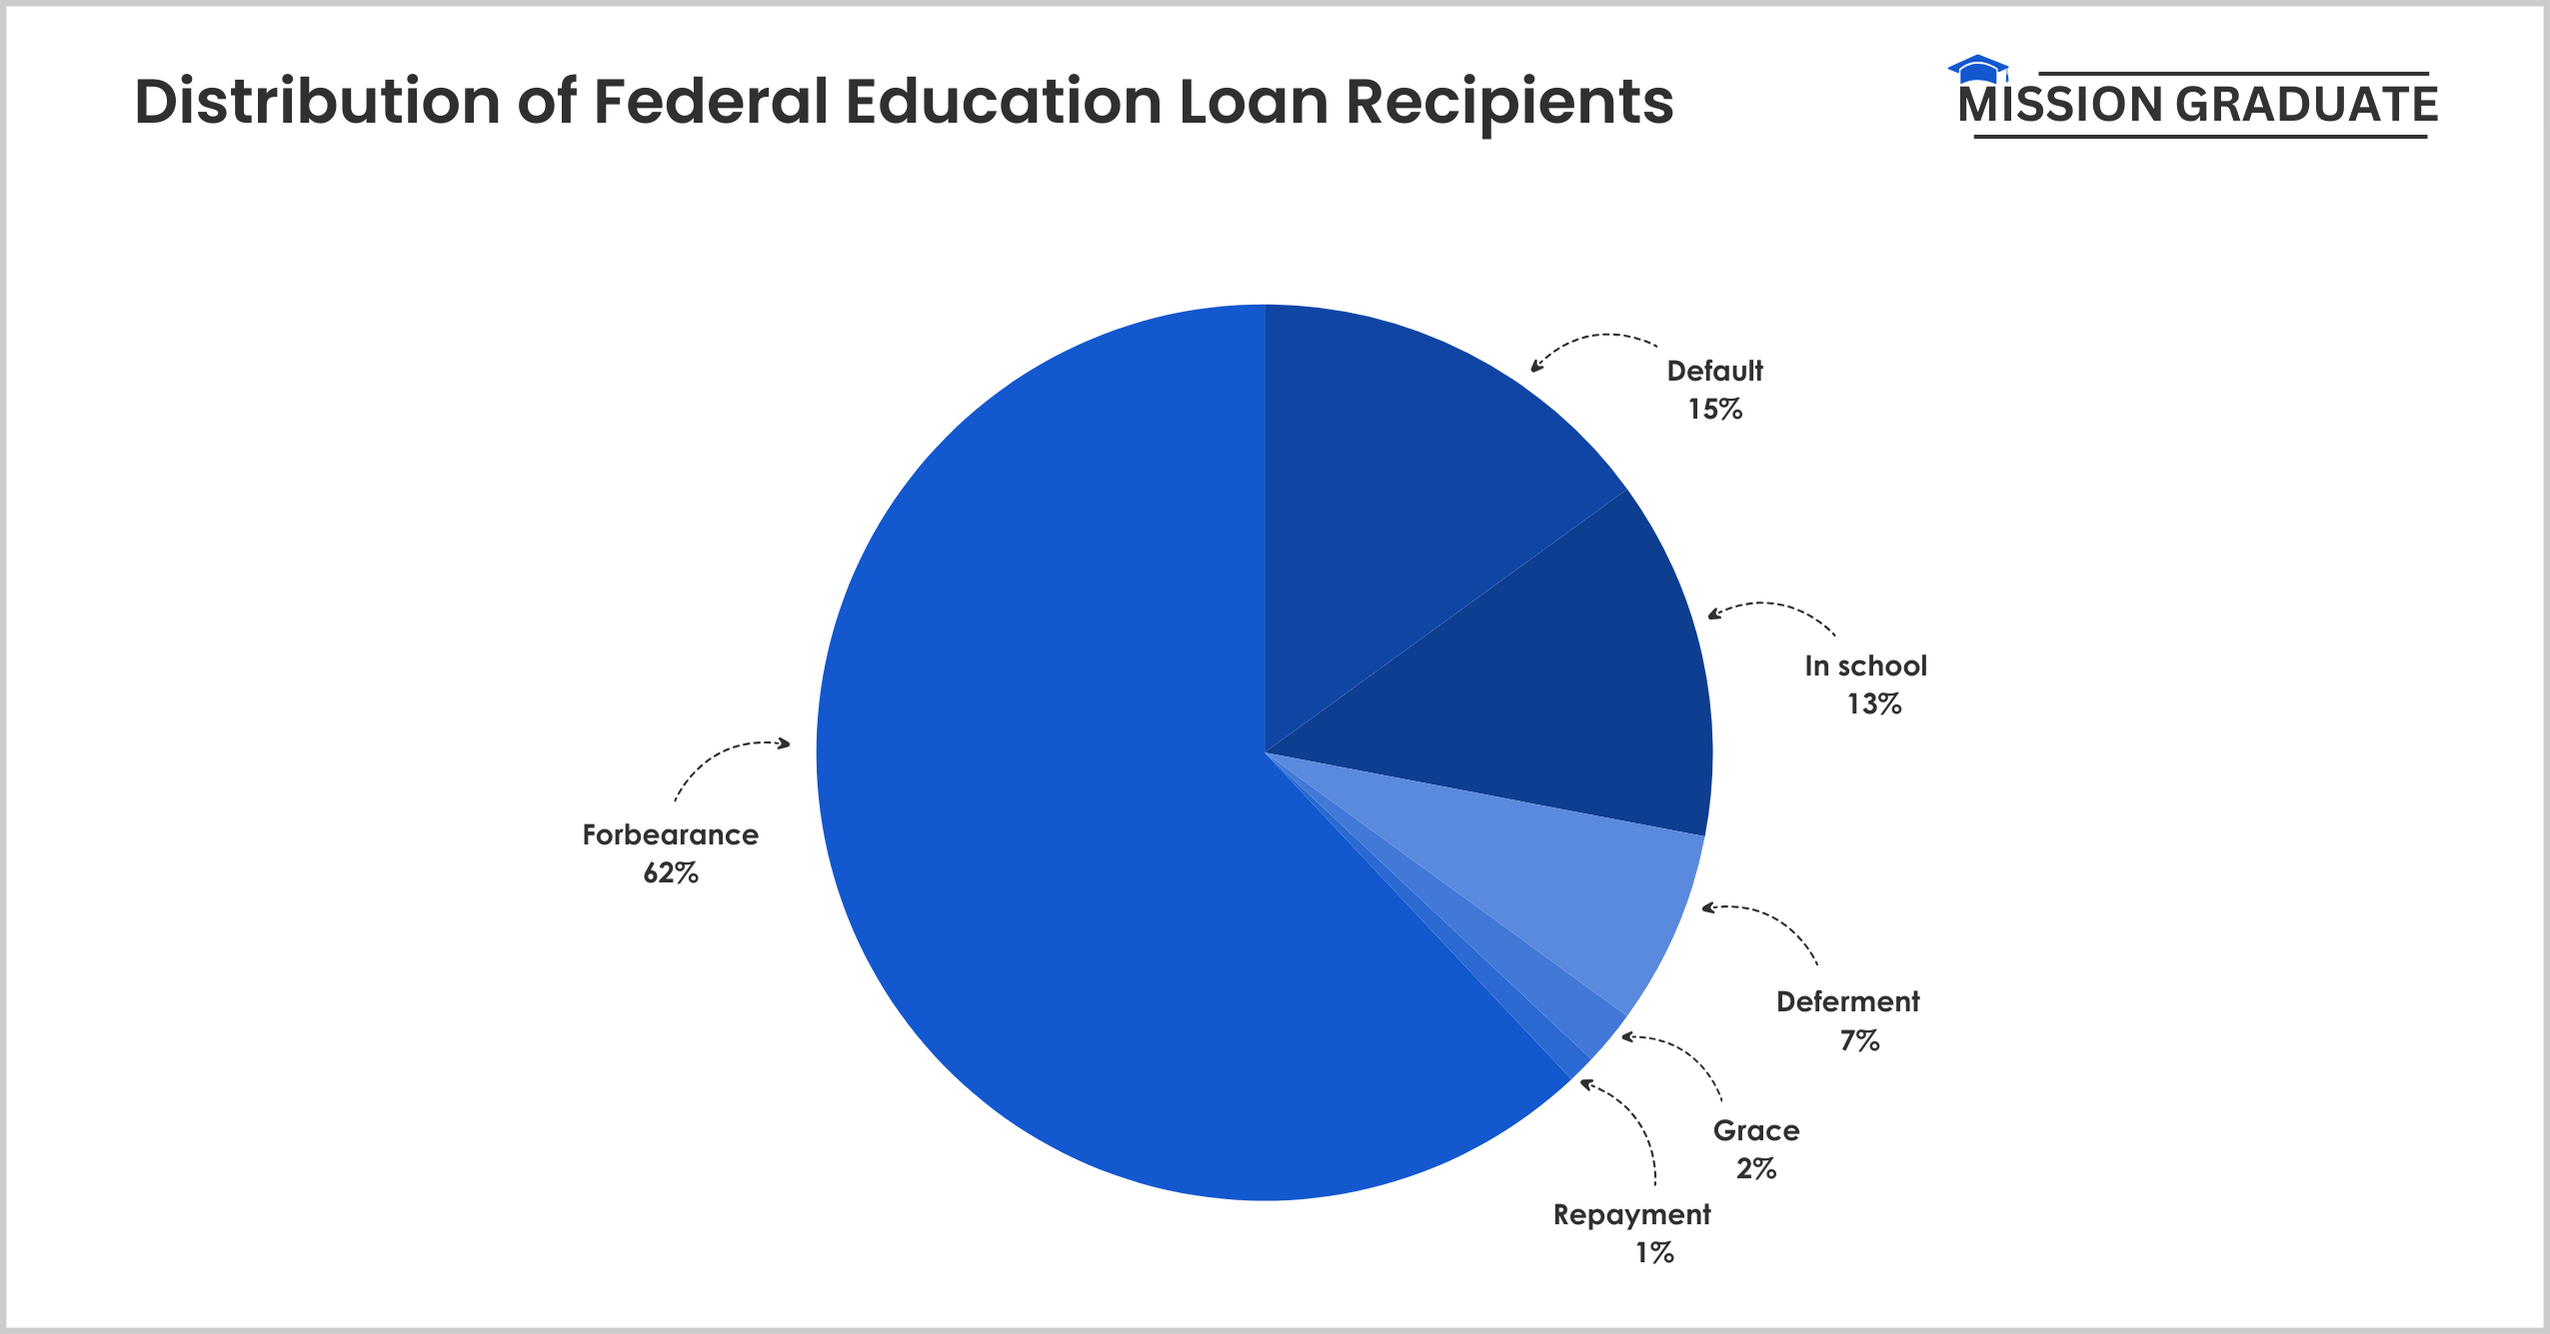
62% Of Student Loans In The U.S. Were In Forbearance In 2023
Only 1% of federal education loan recipients in the United States were in repayment in 2023.
To minimize the financial impact of the pandemic on borrowers, the U.S. Congress moved student loans into forbearance.
Around 15% of loan recipients defaulted, while 13% were in school.

The table below shows the distribution of federal education loan recipients in the United States:
| Repayment Status | Percentage Of Student Loan Recipients |
|---|---|
| Forbearance | 62% |
| Default | 15% |
| In school | 13% |
| Deferment | 7% |
| Grace | 2% |
| Repayment | 1% |
Source: Statista
Black Student Loan Recipients Had A Loan Default Rate Of 34.4%
This was the highest loan default rate in the United States in 2022.
Hispanics had a student loan default rate of 26.6%, while White loan recipients had a student loan default rate of 12.5%.
With 7.5%, Asians had the lowest student loan default rate.
Source: Statista
65% Of Loan Receivers Aged 18 To 29 Indicated They Would Fully Pay Off Their Student Loan Debts
In contrast, 49% of loan recipients aged between 45 and 64 reported that they could not fully pay off their student loan debts.
16% of students aged 18 to 29 and 36% aged 30 to 44 did not believe they could repay their student loan debt.
Source: Statista
Student Loan Forgiveness Statistics
As the burden of student loans continues to impact individuals and families, governments and policymakers are exploring options for student loan forgiveness programs.
Governments are developing various relief programs to help students repay their loans and continue studying.
In this section, let us explore statistics and facts about student loan forgiveness.
The Public Service Loan Forgiveness Program Forgave An Average Amount Of $63,826 Per Borrower
On average, federal student loan forgiveness programs forgave approximately $21,347 in debt for eligible borrowers across the United States.
Teacher Loan Forgiveness Program pardoned around $8,460 per borrower, and the total Permanent Disability Program forgave $18,056 per loan borrower.
Source: Statista
57% Of U.S. Black Adults Wanted To Reenroll In College If Student Loans Were Forgiven
49% of Hispanic adults were most likely to reenroll, while 37% of White adults wanted to reenroll if their current student loans were forgiven.
In addition, 46% of students who stopped out of their bachelor’s degree were more inclined towards reenrolling if their student loans were nulled out.
Source: Statista
Related Read:
Conclusion: US Students Crushed By $37k Loan Debt, Forgiveness Rare
Student loan debt is a burden carried by millions of students, and people who completed their education make up the majority.
With an average student loan debt of $37,088, nearly 43.2 million U.S. citizens have borrowed student loans.
Governments and policymakers are working tirelessly to develop more loan relief programs to help borrowers repay their loans.
These were some of the most important statistics regarding student loan debt, loan borrowers, loan repayment, and forgiveness.

