College graduates are essential assets to the USA’s economy, and the steady growth in the percentage of college graduates over the years marks the nation’s growth.
According to the National Student Clearinghouse Research Center, the overall graduation rate in the United States is 62.2% as of 2023.
Let’s explore in detail the college graduation rates in the United States, the percentage of college graduates in the country, the demographics of college graduates, their employment rates, and more in this post.
Top College Graduation Statistics for 2025
- The average college graduation rate was 62.2% in the United States in 2023.
- 37.7% of the people in the United States had a college degree in 2022.
- 39% of females in the United States had completed four years of college or more, while 36.2% of men have.
- 58% of the men students and 66% of the women graduated from college in 2023.
- With 77.5% and 80.1% of six-year and eight-year graduation rates, private four-year institutions have the highest graduation rate among the four-year institutes.
- The average age for college graduation is 24 years.
- Asians have the highest two-year and four-year college graduation rates.
- With a 69% graduation rate, Rhode Island has the highest college graduation rate in the United States.
- At 38%, New Mexico has the lowest graduation rate in the country.
How Many People Graduate College?
- The college graduation rate was recorded to be 62.2% for all schools in the United States in 2023.
That’s an increase of 2.2 percentage points from the average college graduation rate of 60% recorded at four-year colleges between 2008 and 2021.
- 49.1% of college graduates earn Bachelor’s degrees. However, 22.3% of the students require more than four years to complete their graduation.
- On average, 24.5% of the graduates have an associate’s degree.
- Over the last 10 years, the number of graduates has increased at an annual rate of 1.0%.
Percentage Of Americans With College Degrees
- 37.7% of Americans had a college degree in 2022.
That was a slight decline from 37.9% of the Americans with college degrees recorded in 2021.
However, that is indeed a significant increase from just 7.7% of Americans who graduated from college in 1960.
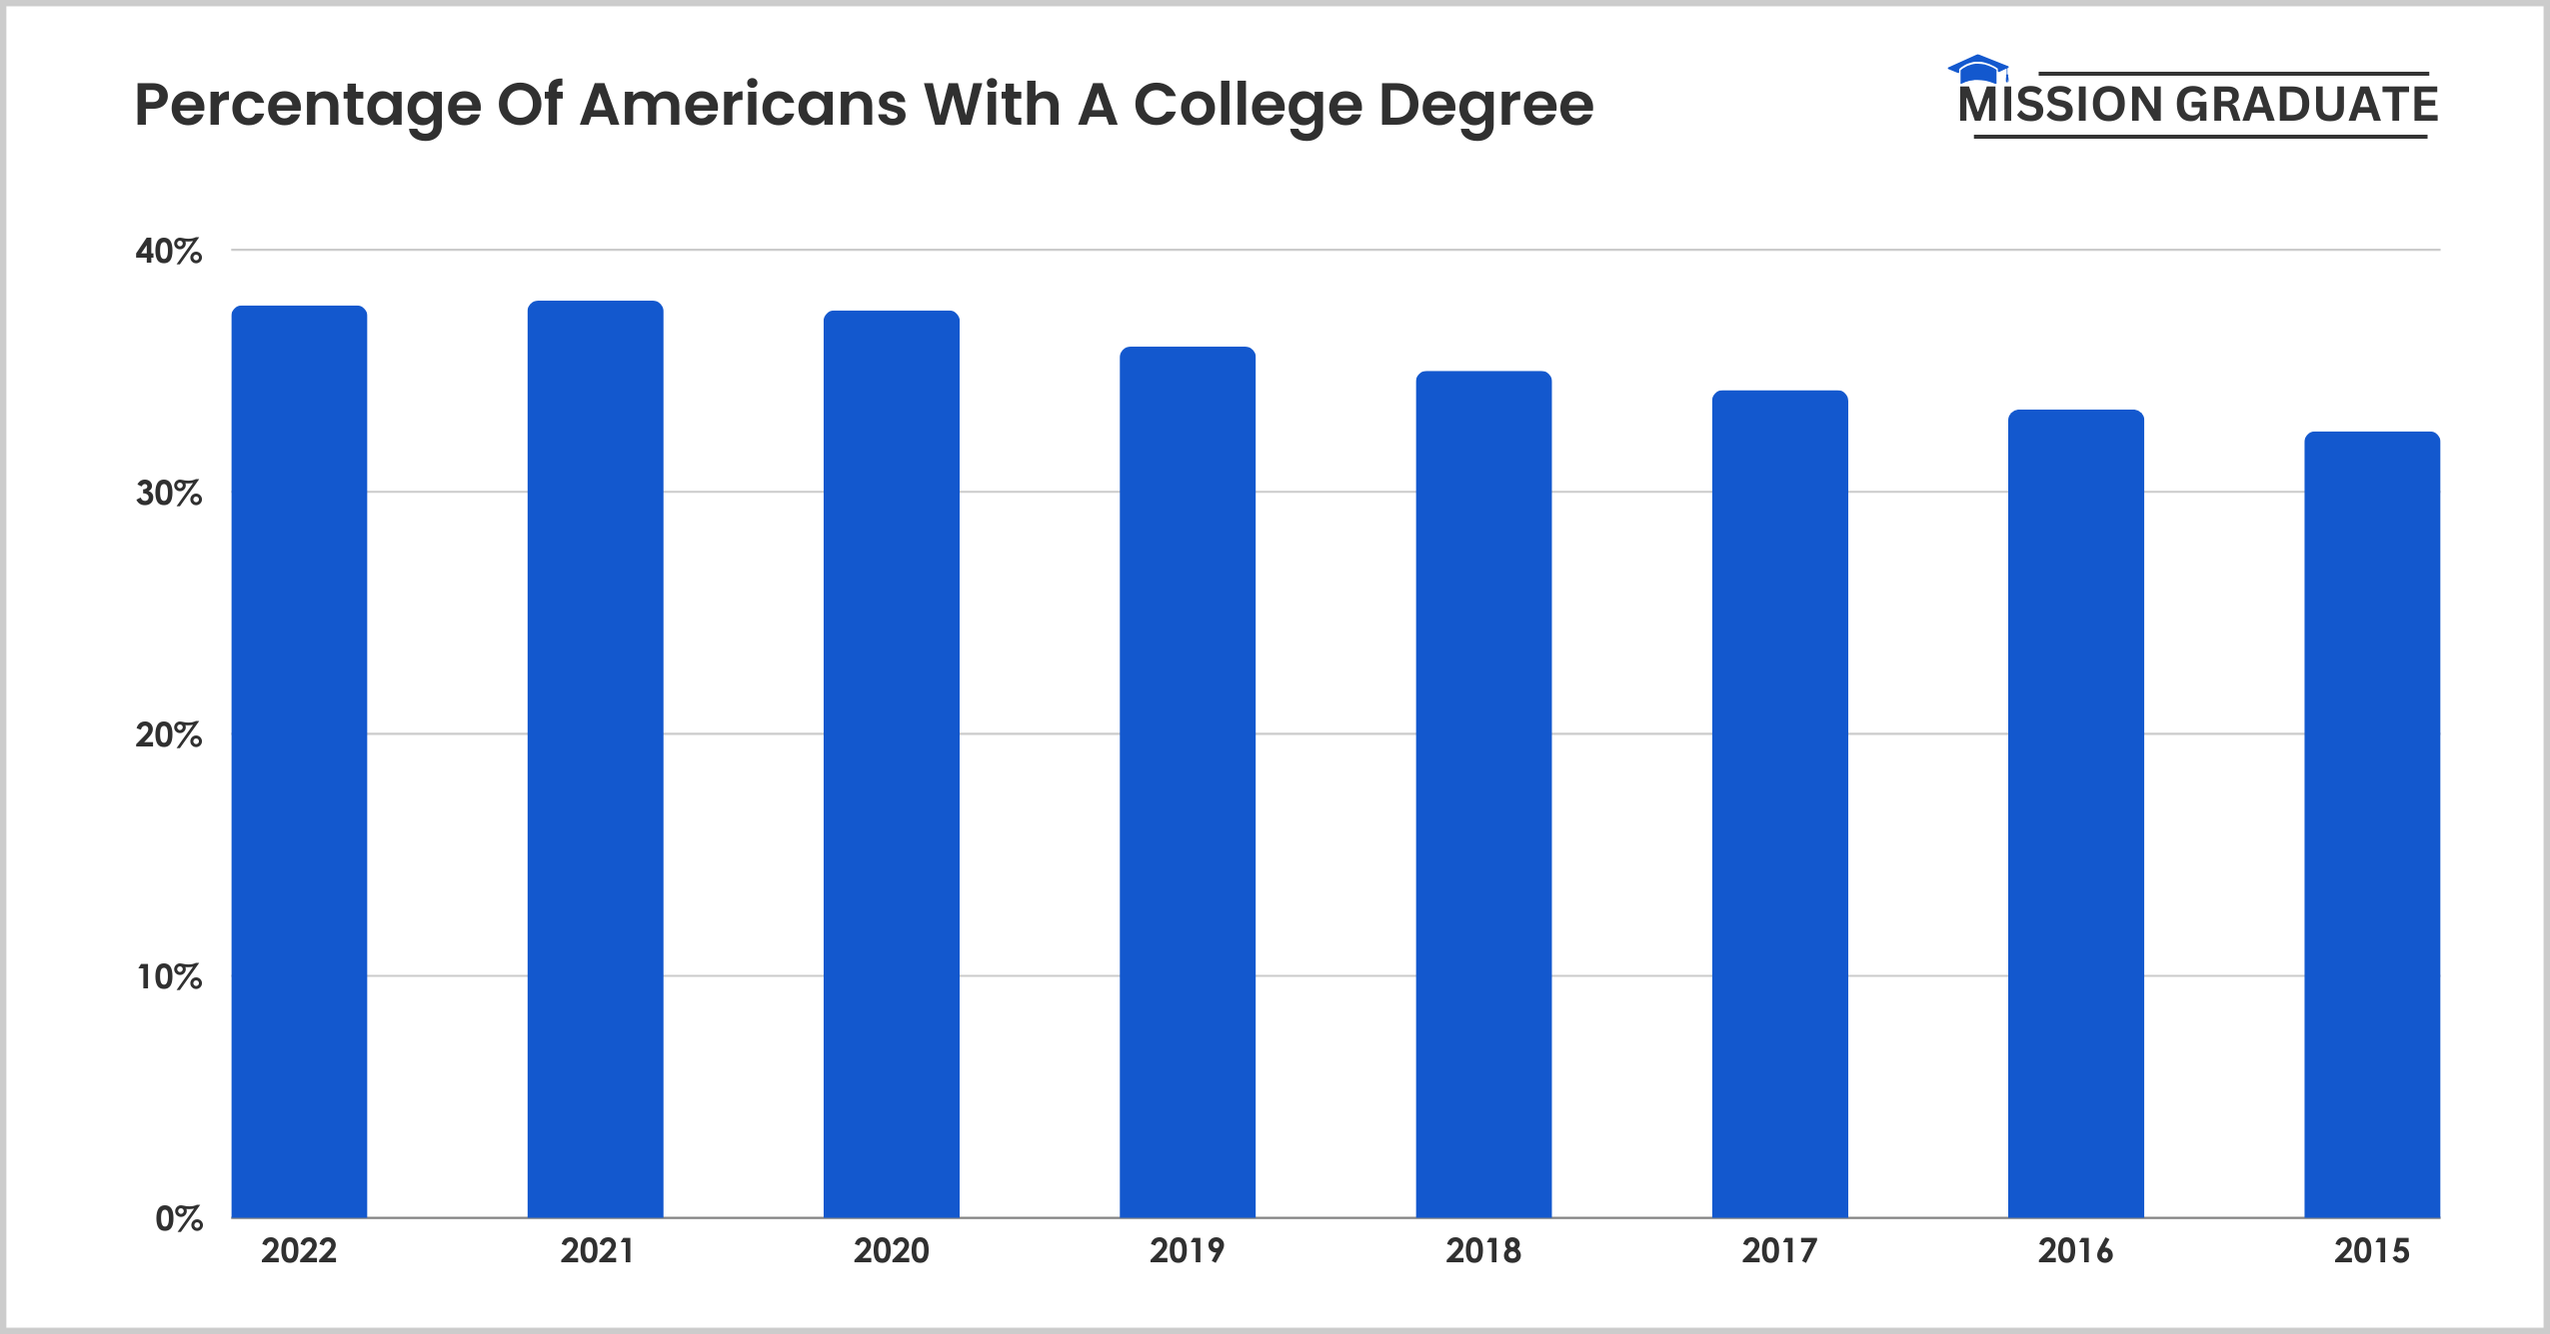
The following table displays the percentage of Americans with a college degree recorded over the years:
| Year | Percentage of Americans With a College Degree |
|---|---|
| 2022 | 37.70% |
| 2021 | 37.90% |
| 2020 | 37.50% |
| 2019 | 36% |
| 2018 | 35% |
| 2017 | 34.20% |
| 2016 | 33.40% |
| 2015 | 32.50% |
| 2014 | 32% |
| 2013 | 31.70% |
| 2012 | 30.90% |
| 2011 | 30.40% |
| 2010 | 29.90% |
Source: Statista
- As of 2022, 39% of females in the United States had completed four years of college or more.
That’s an increase from just 3.8% of the women in the United States who completed four years or more of college in 1940.
Conversely, 36.2% of men in the United States have completed four or more years of college in 2022. Comparatively, just 5.5% of the men in the United States had a college degree in 1940.
The following table displays the percentage of male and female Americans who have completed four or more years of college degrees.
| Year | Percentage of Men | Percentage of Women |
|---|---|---|
| 2022 | 36.2% | 39% |
| 2021 | 36.6% | 39.1% |
| 2020 | 36.7% | 38.3% |
| 2019 | 35.4% | 36.6% |
| 2018 | 34.6% | 35.3% |
| 2017 | 33.7% | 34.6% |
| 2016 | 33.2% | 33.7% |
| 2015 | 32.3% | 32.7% |
| 2014 | 31.9% | 32% |
| 2013 | 32% | 31.4% |
| 2012 | 31.4% | 30.6% |
Source: Statista
College Graduation Rate By College Type
- Private four-year institutions have the highest graduation rate among the four-year institutes.
Conversely, for-profit schools have the lowest graduation rates among the four-year institutes.
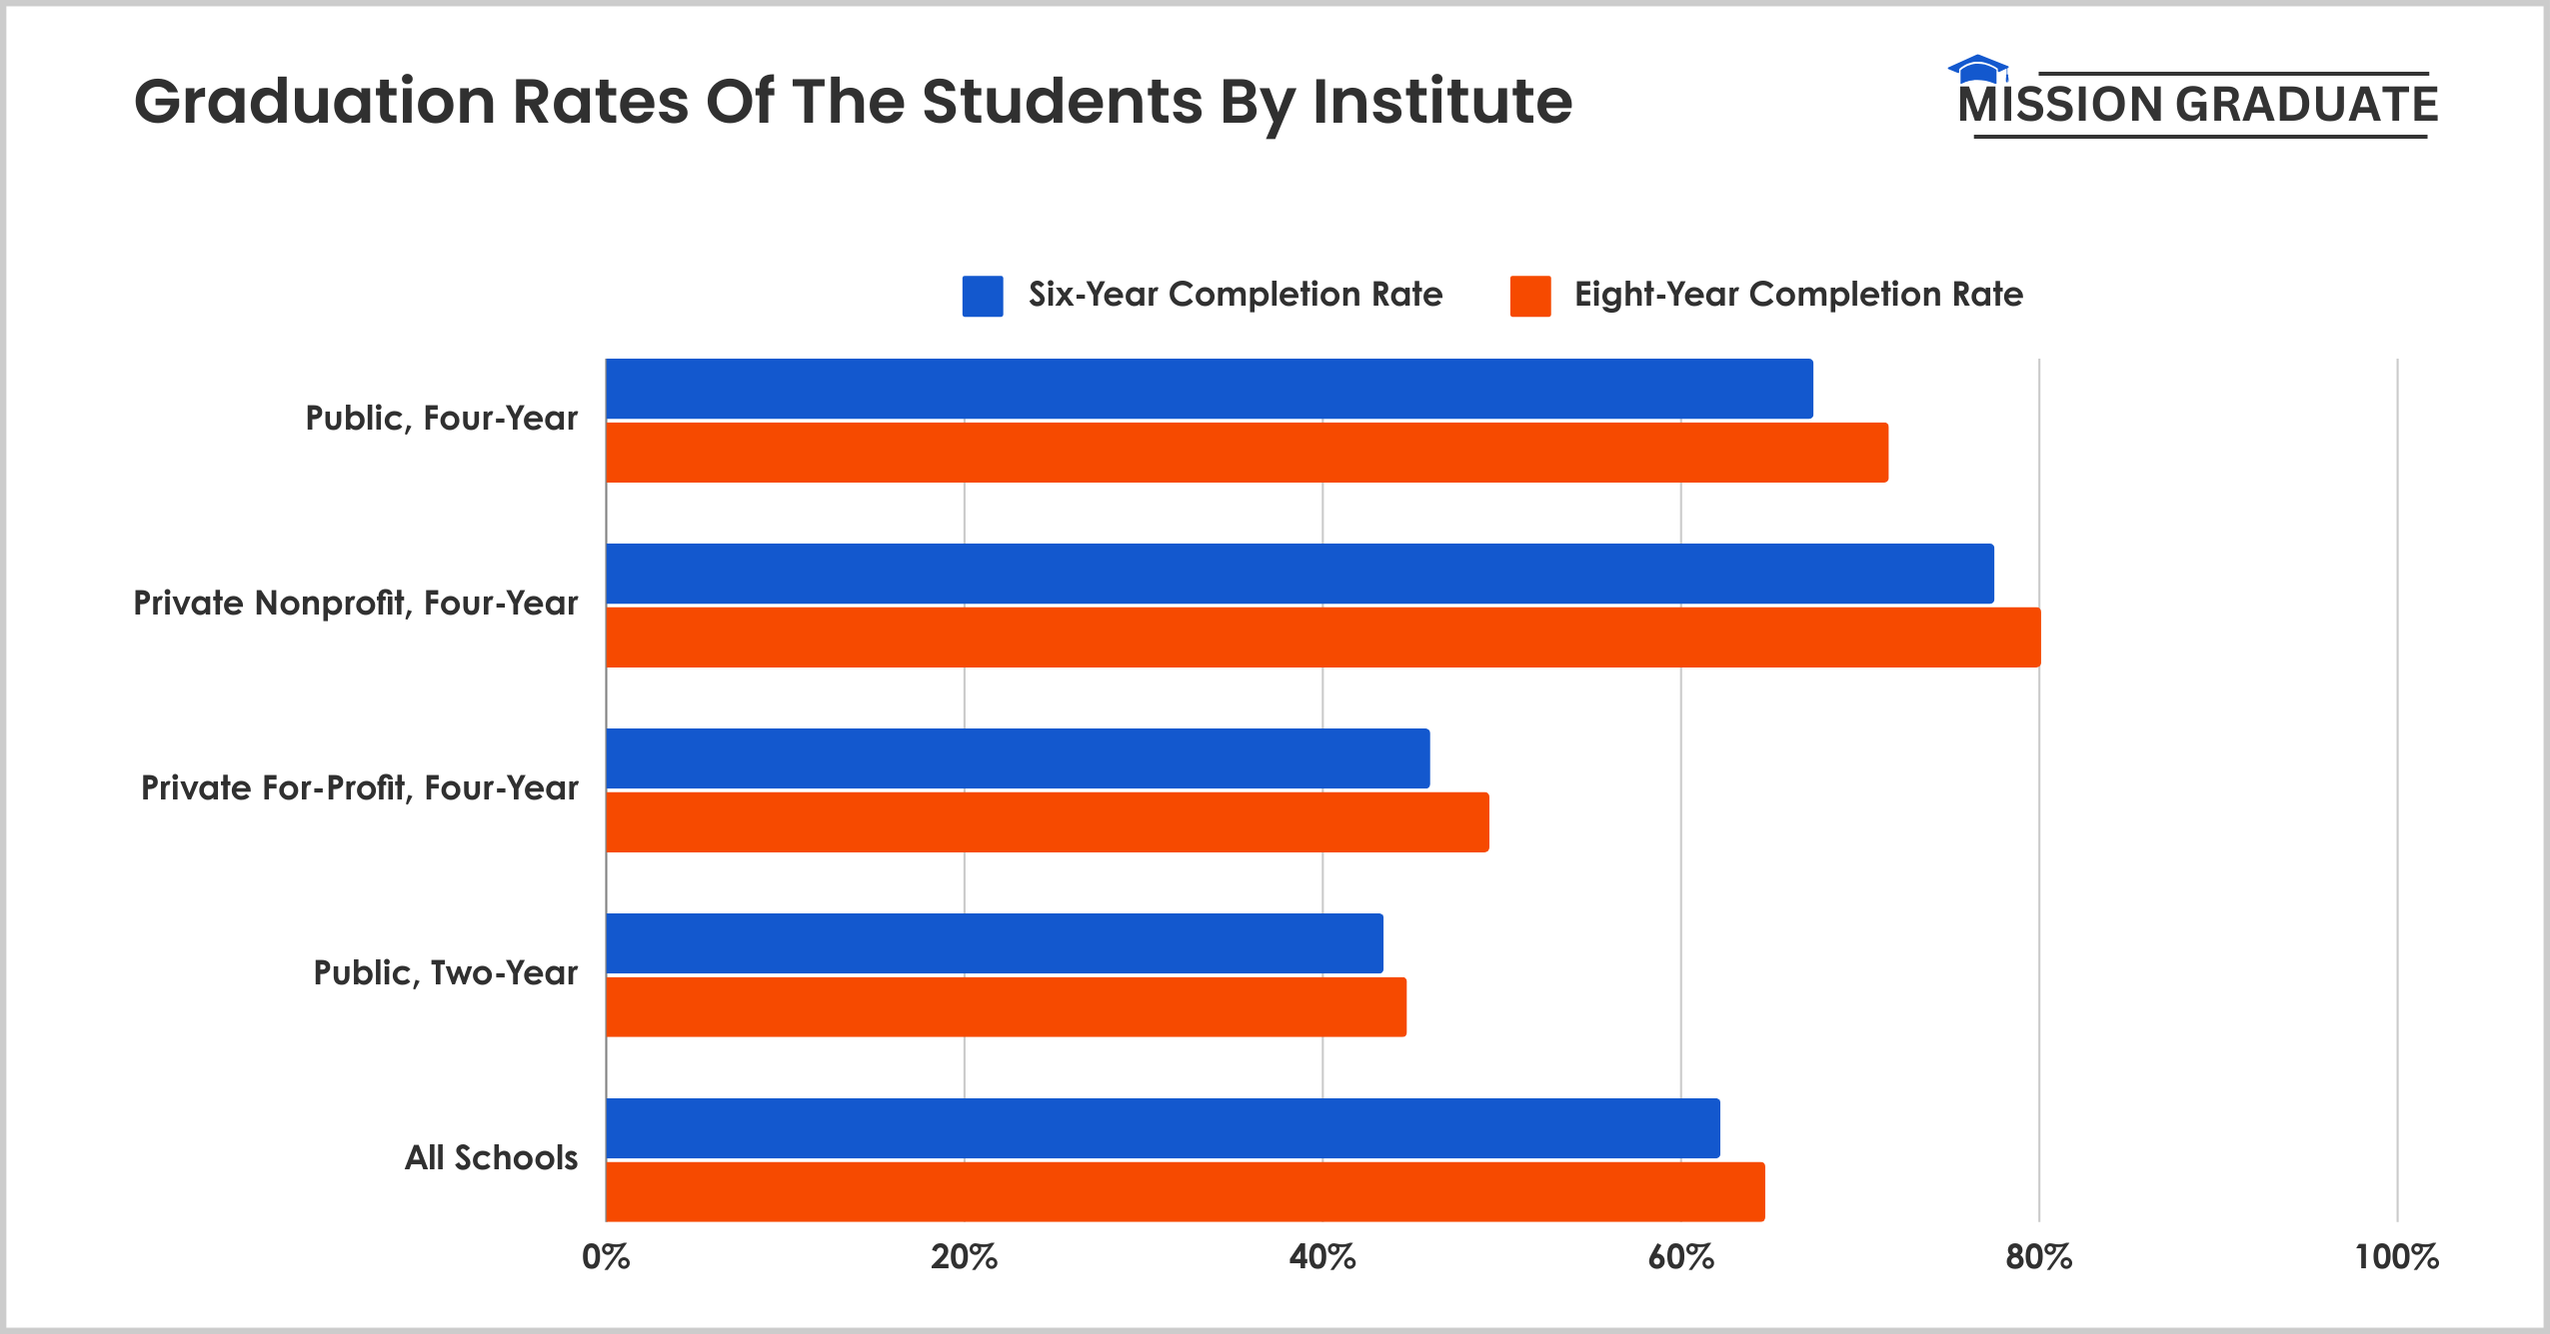
Here is a table displaying the graduation rates of the students in different institutes as of 2023.
| Institution Type | Six-Year Completion Rate | Eight-Year Completion Rate |
|---|---|---|
| Public, Four-Year | 67.4% | 71.6% |
| Private Nonprofit, Four-Year | 77.5% | 80.1% |
| Private For-Profit, Four-Year | 46% | 49.3% |
| Public, Two-Year | 43.4% | 44.7% |
| All Schools | 62.2% | 64.7% |
Source: NSCRC
- Similarly, a higher graduation rate is recorded at private institutions for two-year colleges.
On the other hand, the lowest graduation rates are recorded at public two-year colleges in the United States.
The following table displays the graduation rates recorded at two-year colleges as of 2021.
| Institution Type | Three-Year Completion Rate |
|---|---|
| Public | 30.2% |
| Private Nonprofit | 59.6% |
| Private For-Profit | 59.9% |
| All School Types | 34.6% |
Source: NCES
- Just 8% of community college students get transferred to four-year schools to complete their degrees.
As of 2023, a total of 43.4% of the community college students graduated, and just 7.7% of the students graduated from four-year school.
At the same time, 11.2% of the college students were still enrolled after six years in college.
The following table displays the six-year graduation rate recorded at public two-year colleges.
| State | 6-year Graduation Rate |
|---|---|
| Total Graduated | 43.4% |
| Graduated from a four-year school | 7.7% |
| Still enrolled | 11.2% |
| No longer enrolled | 45.4% |
Source: NSCRC
College Graduation Rates By Gender
- Of the graduating students in 2023, 66% were women, and 58% were men.
- 71% of women and 63% of men students graduated from the public four-year college in 2023.
- 74% of male and 80% of female students graduated from private nonprofit four-year colleges.
- The number of female students who graduated from four-year colleges between 2008 and 2022 was 4 to 6 percentage points higher than the number of male students that graduated.
- Male students are more likely to drop out of college, with a completion rate of 61.1% within 6 years. On the other hand, female students graduated with a completion rate of 67.6%.
- In 2023, 47% of women and 41% of men graduated from public two-year colleges.
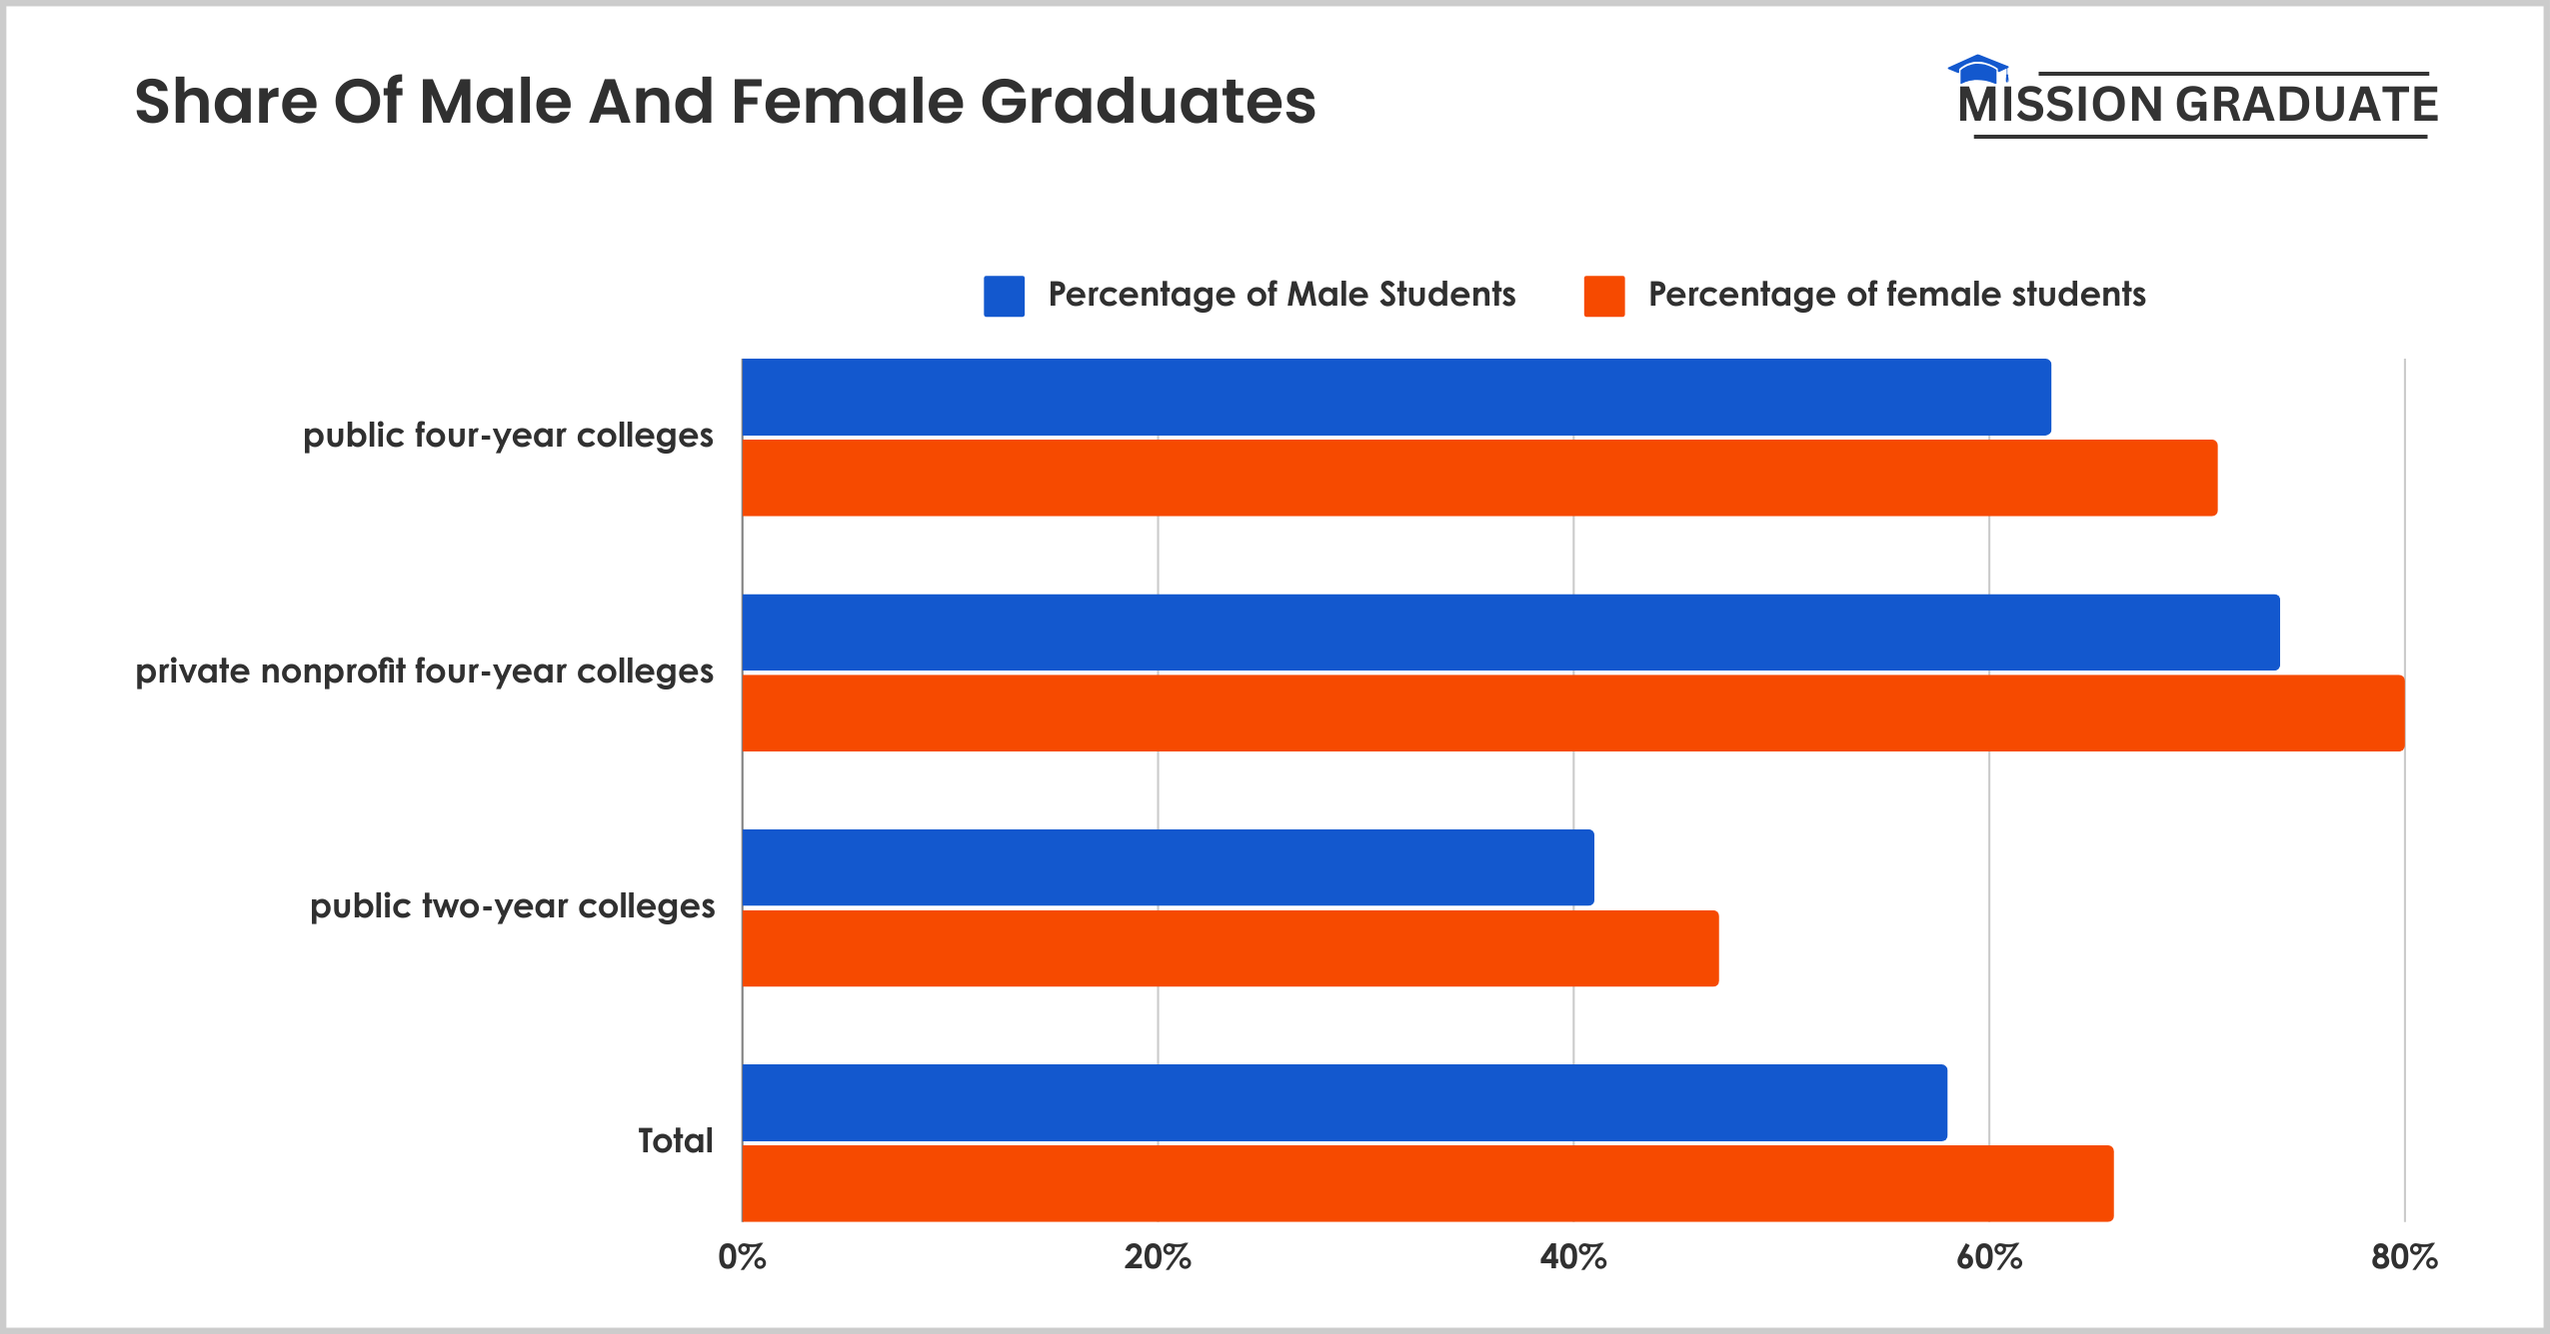
The following table provides further details about the percentage of male and female students who graduated from colleges in 2023.
| Institute Type | Percentage of Male Students | Percentage of Female Students |
|---|---|---|
| public four-year colleges | 63% | 71% |
| private nonprofit four-year colleges | 74% | 80% |
| public two-year colleges | 41% | 47% |
| Total | 58% | 66% |
- 116,110 female students earned professional or doctorate degrees. The percentage of females that earned these degrees made 57.0% of all doctorates & professional degrees earned.
- Female students with bachelor’s degrees outnumbered male students since 2015.
Source: NSCRC, NCES, Education Data
What Age Do People Graduate College?
- The average age to graduate college is 24 years. Meanwhile, the average age of a college student is 26 years.
- Nearly 7 in 10 students who enroll in a bachelor’s degree at 18 or younger graduate within 5 years.
At the same time, 62.2% of the students that enroll in bachelor’s degrees at 19 years graduate within 5 years.
However, only 22% of the students who enroll in bachelor’s degrees at 20 to 23 years old graduate within 5 years.
- 76.2% of college students get enrolled as teenagers.
- Nearly 64% of students aged 18 to 19 are enrolled in college. Meanwhile, Over 1 in 2 students of 20 to 21 years old are enrolled in college.
- Just 8.4% of the students who enroll in college at the age of 24 to 29 years graduate within 5 years.
- Only 14.2% of the students aged 30 years or older graduate from college.
- The college enrollment of students aged 25 to 29 years increased by 15.1%, from 9.3% to 10.7% since 1980.
- Enrollment of adults aged 30 to 34 years witnessed a decrease of 25.5% from 6.4% to 5.1%.
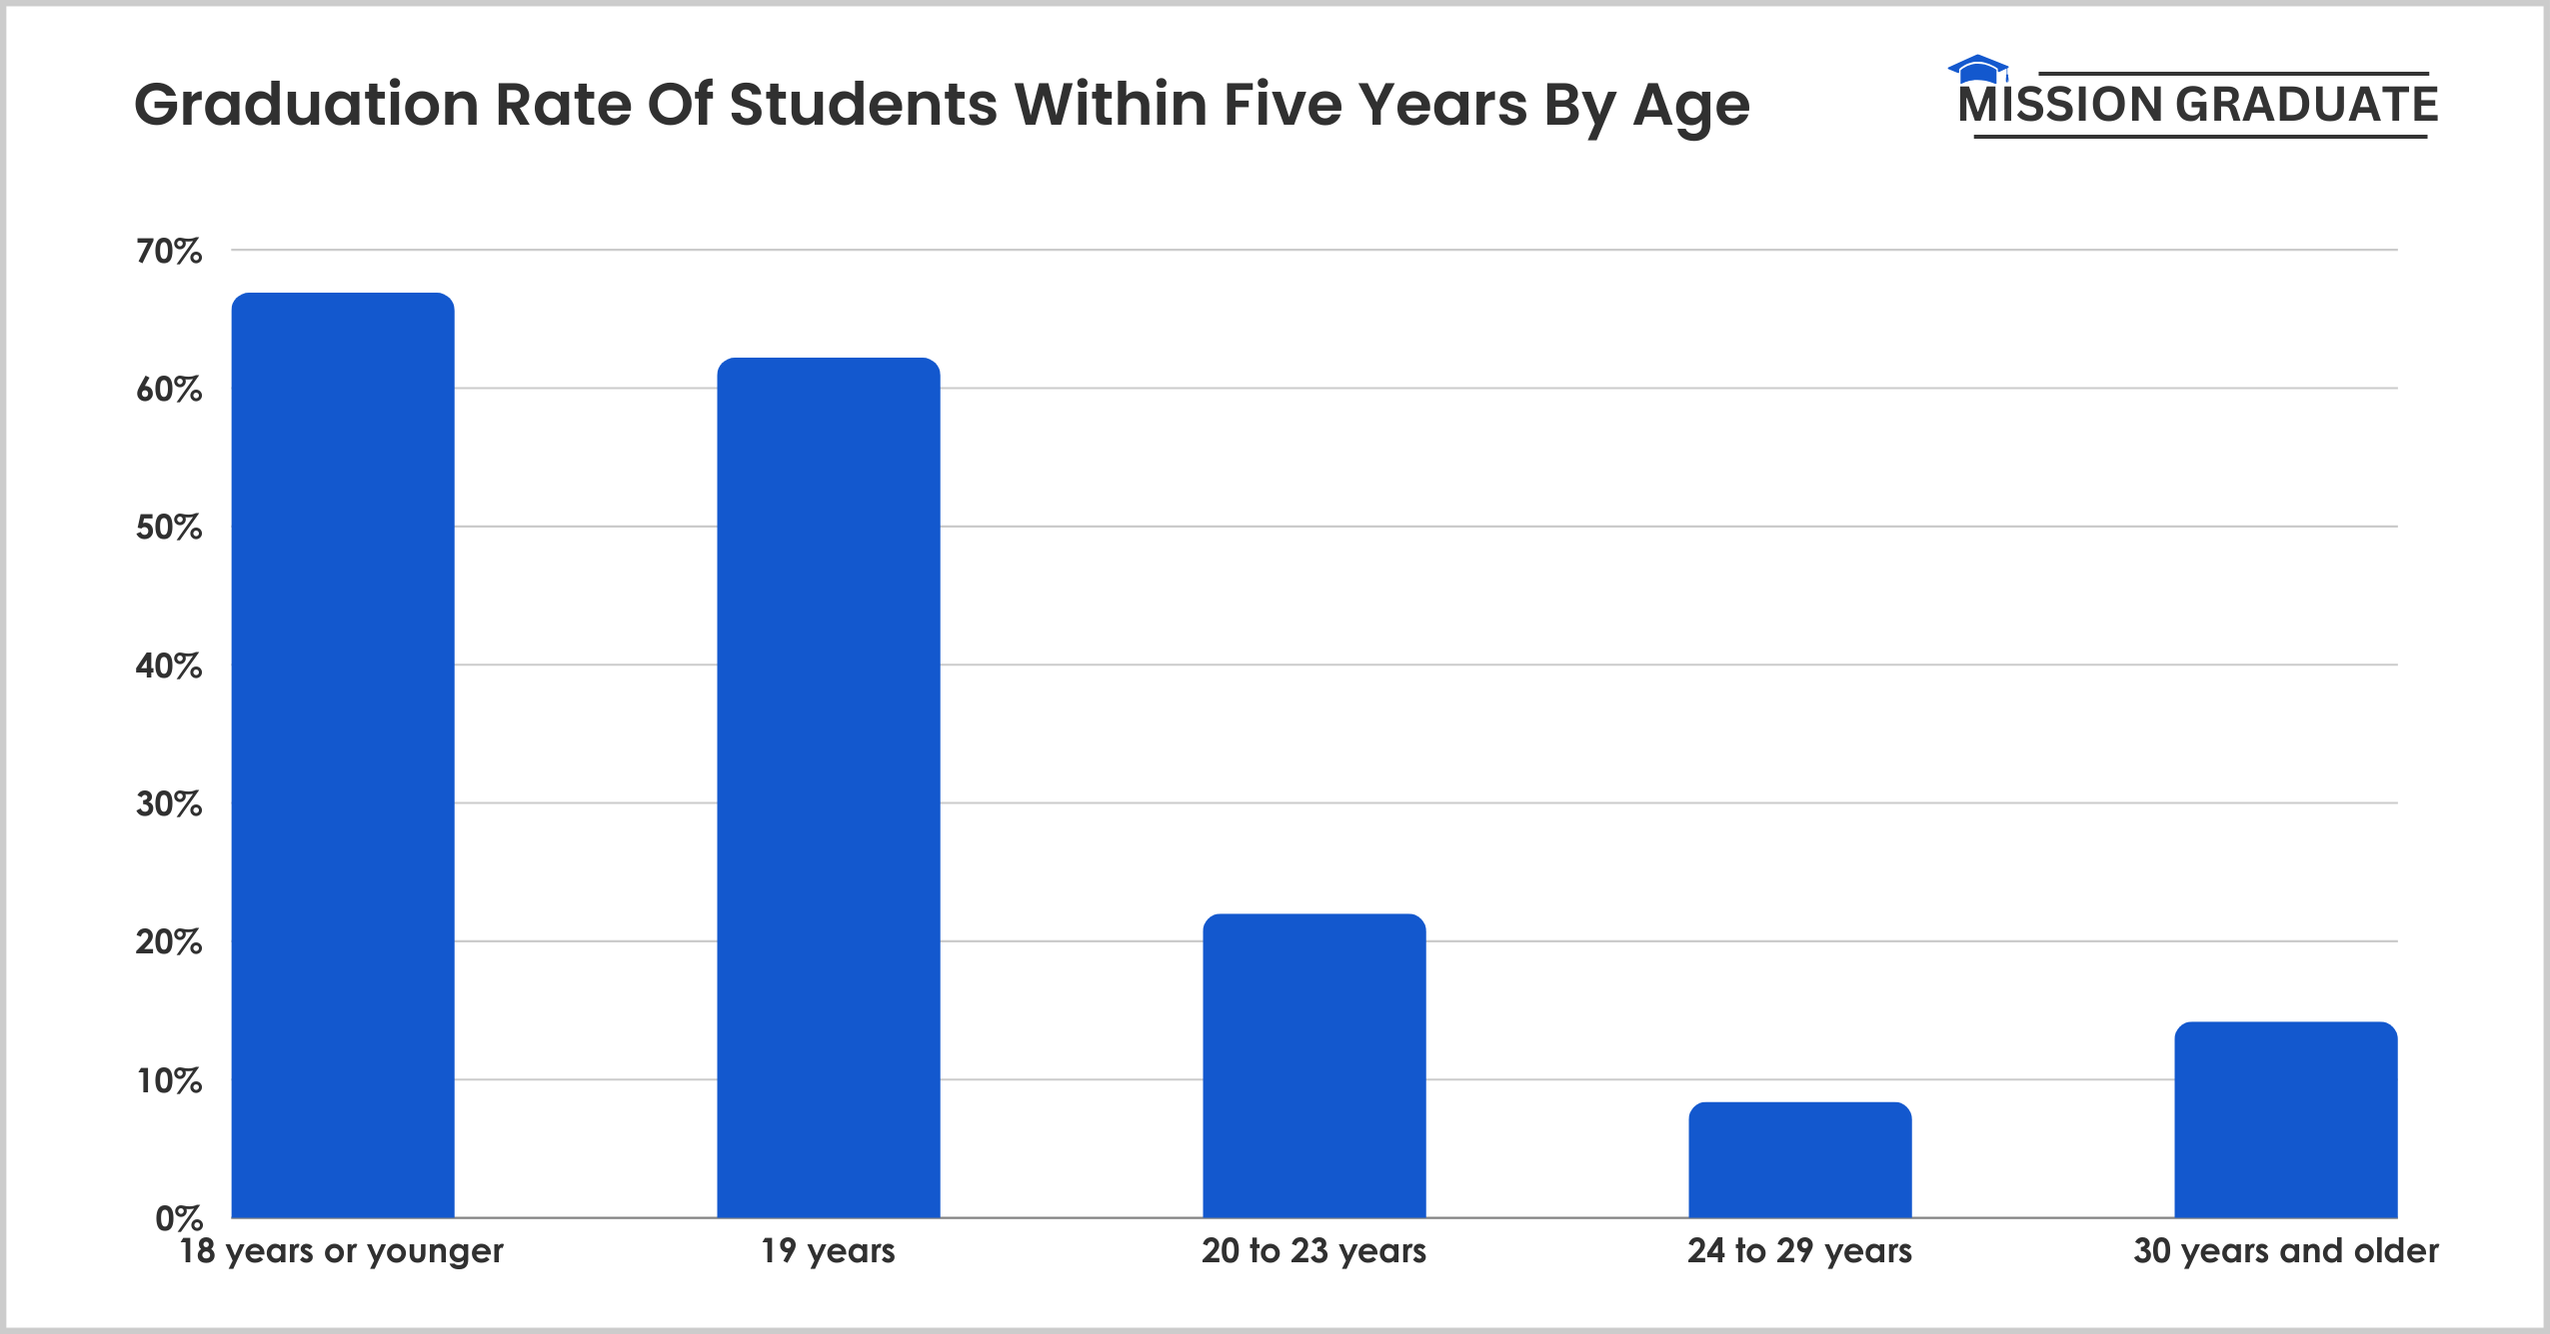
The following table displays the graduation rate of students in different age groups who graduated within five years.
| Age Group | Percentage of Students that Graduate Within Five Years |
|---|---|
| 18 years or younger | 66.9% |
| 19 years | 62.2% |
| 20 to 23 years | 22.0% |
| 24 to 29 years | 8.4% |
| 30 years and older | 14.2% |
Source: Learn, Education Data
College Graduation Rates By Race
- 28.5% of the students enrolled in 2-year institutes in 2019 that graduated were American Indian/ Alaska Native.
At the same time, 44.1% of Asian students graduated from the country’s two-year institutes, and nearly one-fourth of Black students graduated.
The following table displays the rate of graduation of students belonging to different age groups among the students enrolled in 2019.
| Race | Graduation Rate of Students at 2-year Institutes |
|---|---|
| American Indian/Alaska Native | 28.5% |
| Asian | 44.1% |
| Black | 25.3% |
| Hispanic | 31.3% |
| Pacific Islander | 27.8% |
| White | 37.9% |
| Two or more races | 29.3% |
| Nonresident | 40.5% |
- 35.1% of the White students enrolled in public four-year institutions in 2019 graduated.
At the same time, 42% Asians, and 22.4% American Indian or Alaska Natives enrolled in 2019 graduated from public four-year institutions.
The following table displays the graduation rate of students enrolled in four-year public institutions in 2019 by race.
| Race | Graduation Rate of Students at Public Four-year Institutes |
|---|---|
| American Indian/Alaska Native | 22.4% |
| Asian | 42.0% |
| Black | 19.0% |
| Hispanic | 25.9% |
| Pacific Islander | 21.1% |
| White | 35.1% |
| Two or more races | 26.2% |
| Nonresident | 39.6% |
- 63.9% of the white students enrolled in private non-profit institutions in 2019 graduated.
Meanwhile, 85.7% of Asian students enrolled at four-year private non-profit institutions in 2019 graduated.
Asian students had the highest graduation rates at private non-profit institutions.
The following table displays the graduation rate of college students from different races enrolled in private non-profit institutions in 2019.
| Race | Graduation Rate of Students at Private Non-Profit Four-year Institutes |
|---|---|
| American Indian/Alaska Native | 50.7% |
| Asian | 63.4% |
| Black | 44.3% |
| Hispanic | 60.6% |
| Pacific Islander | 48.7% |
| White | 60.5% |
| Two or more races | 49.5% |
| Nonresident | 60.9% |
- 60.5% of White students enrolled in 2019 graduated from private for-profit institutions.
Besides, the graduation rate of Asian students in these institutes was 63.4%, while 44.3% of the Black students graduated.
The following table displays the graduation rate of students in private for-profit institutions enrolled in 2019 by race.
| Race | Graduation Rate of Students at Private For-profit Four-year Institutes |
|---|---|
| American Indian/Alaska Native | 50.7% |
| Asian | 63.4% |
| Black | 44.3% |
| Hispanic | 60.6% |
| Pacific Islander | 48.7% |
| White | 60.5% |
| Two or more races | 49.5% |
| Nonresident | 60.9% |
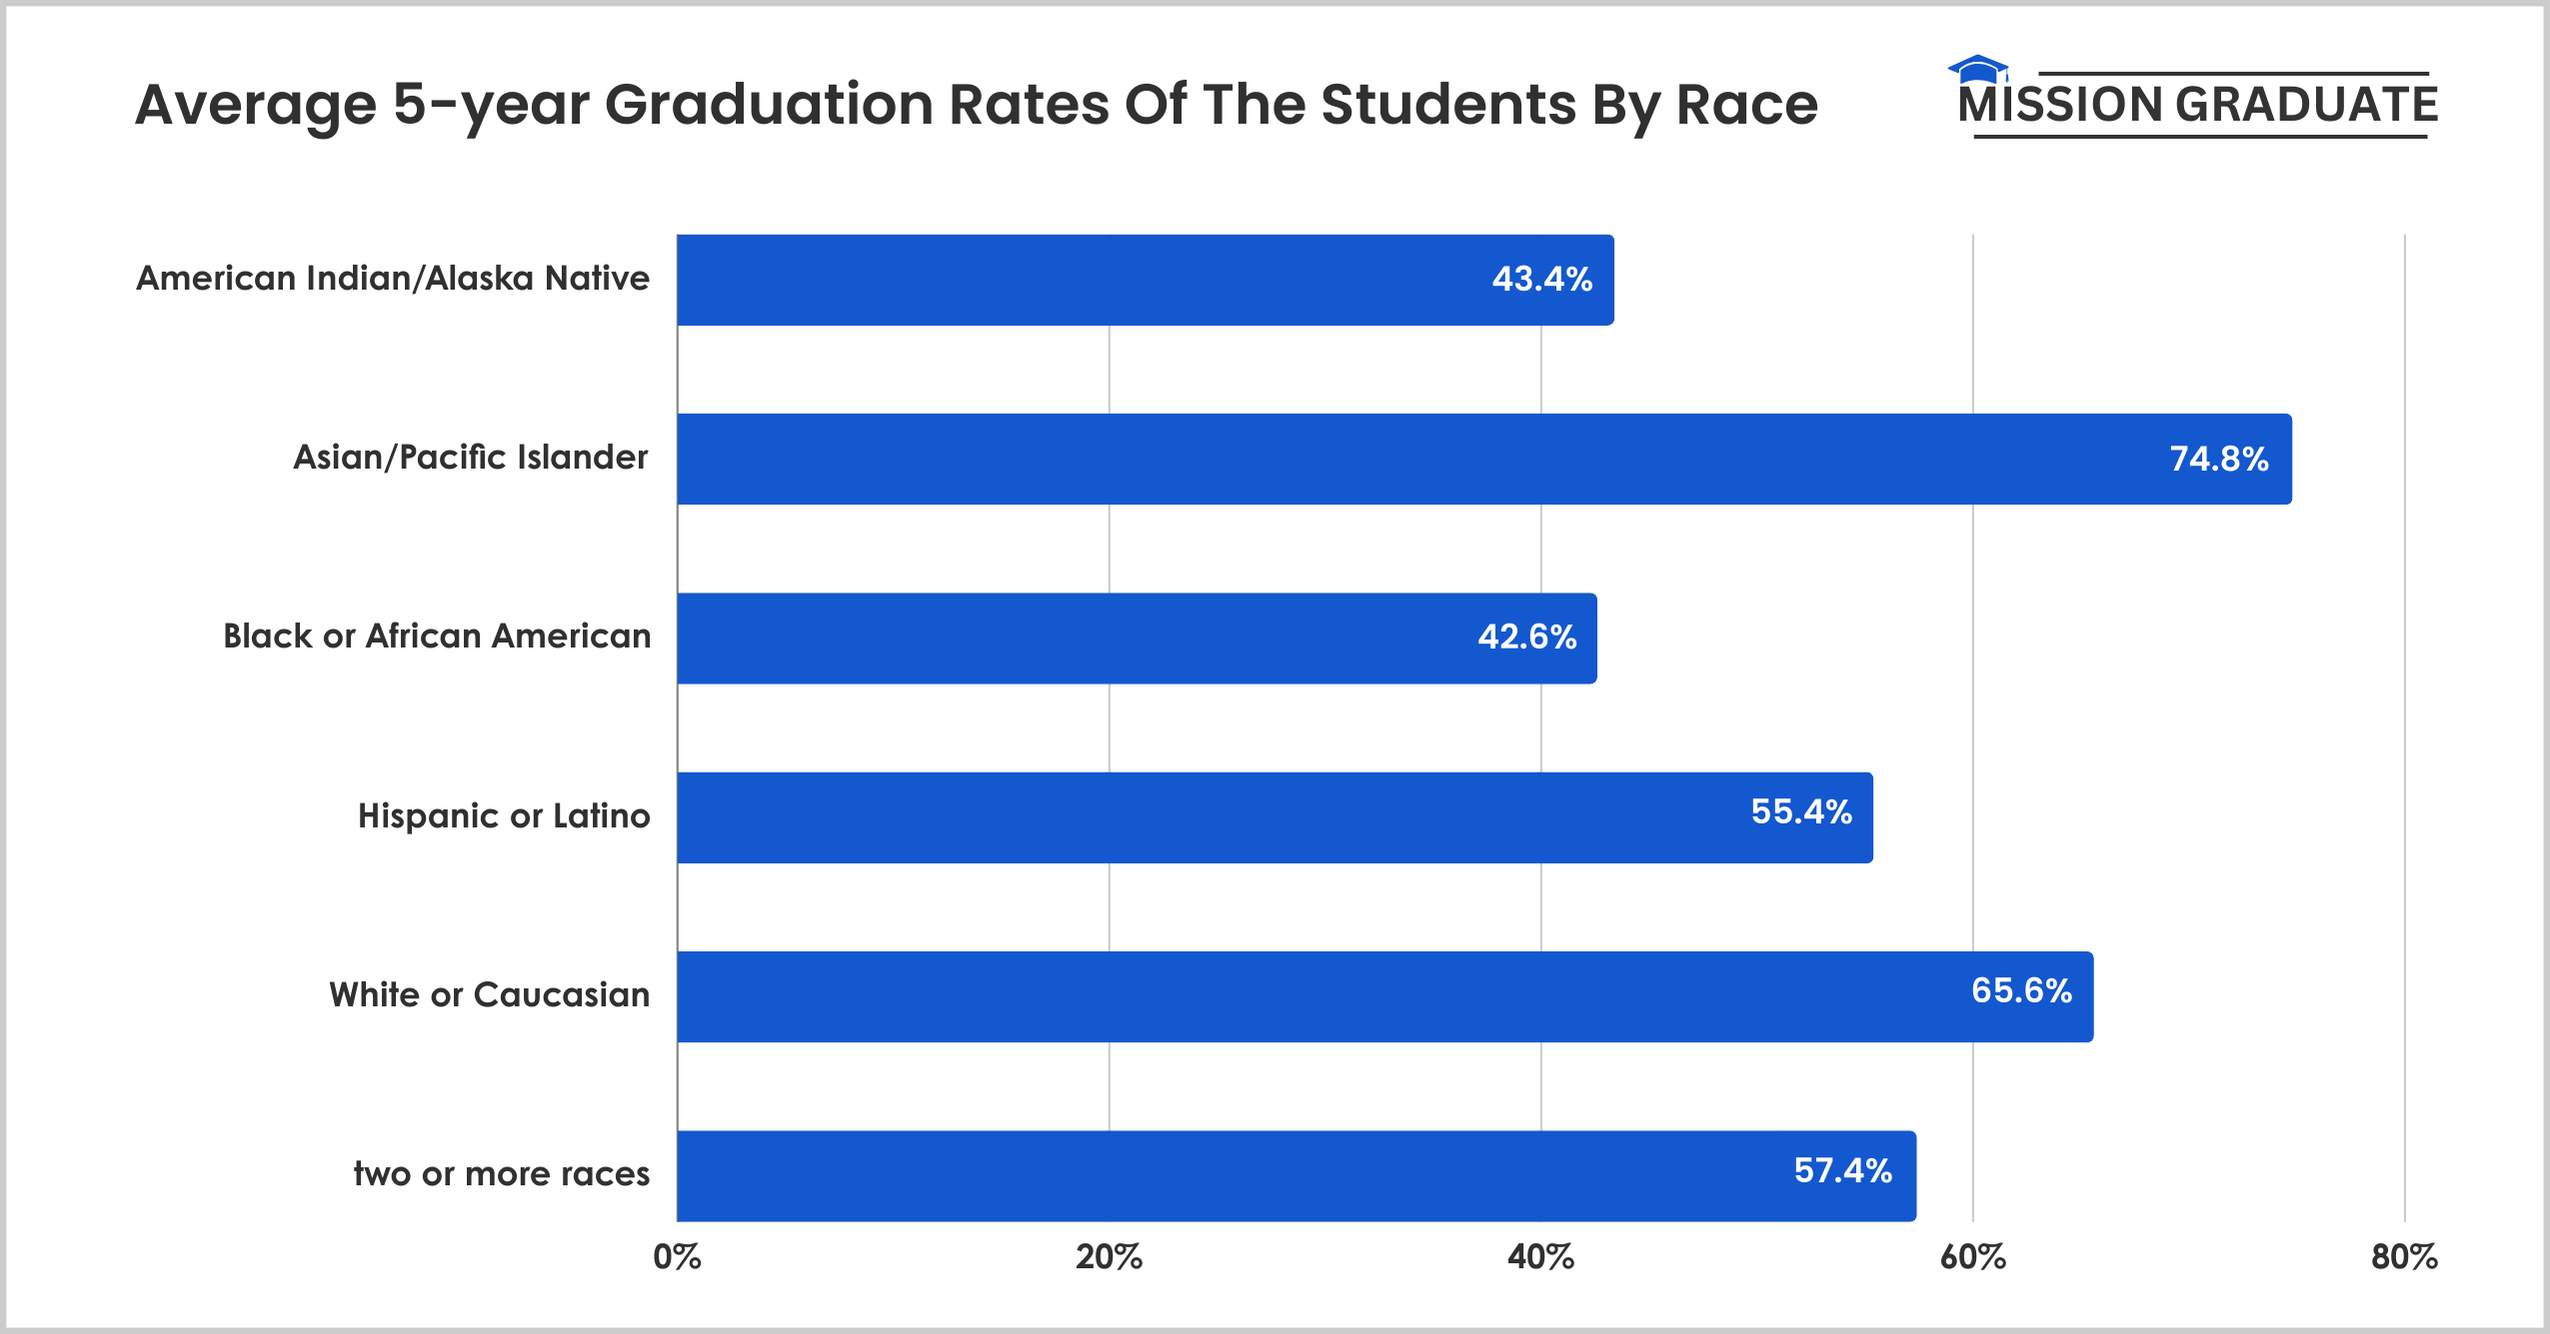
- American Indian/Alaska Native students have a 5-year bachelor-graduation rate of 43.4%.
At the same time, Asian/Pacific Islander students have a 5-year graduation rate of 74.8%.
Besides, students with two or more races have a 5-year graduation rate of 57.4%.
The following table displays the average 5-year graduation rates of the students by race:
| Race / Ethnicity | 5-year Graduation Rates |
|---|---|
| American Indian/Alaska Native | 43.4%. |
| Asian/Pacific Islander | 74.8% |
| Black or African American | 42.6% |
| Hispanic or Latino | 55.4% |
| White or Caucasian | 65.6% |
| two or more races | 57.4% |
- Only 0.5% of the college graduates in the United States are American Indian/Alaska Native. It accounts for 21,530 students.
The following table displays the percentage of American Indian/Alaska Native students who graduate with different degrees.
| Graduation Degree | Percentage of American Indian/Alaska Native students graduating | Number of American Indian/Alaska Native Students | Percentage of Degrees |
|---|---|---|---|
| Associate’s degrees | 38.0% | 8,170 | 0.8% |
| Bachelor’s degrees. | 41.4% | 8,910 | 0.4% |
| Master’s degrees. | 17.3% | 3,720 | 0.4% |
| Doctorate or professional degrees. | 3.4% | 720 | 0.4% |
- 329,170 of the students graduating from college are Asian/Pacific Islanders.
They account for 8.0% of the students.
Here is a table displaying the number of Asian/Pacific Islanders graduating with different degrees.
| Graduation Degree | Percentage of Asian/Pacific Islanders students graduating | Number of Asian/Pacific Islanders Students |
|---|---|---|
| Associate’s degrees | 20.5% | 67,580 |
| Bachelor’s degrees. | 53.0% | 174,600 |
| Master’s degrees. | 19.5% | 64,140 |
| Doctorate or professional degrees. | 6.9% | 22,850 |
- Black or African American students who graduated from different colleges had a graduation rate of 10.7%.
It means that 439,130 Black or African American students graduate from college.
The following table displays the percentage and number of Black or African American graduate students.
| Graduation Degree | Percentage of Black or African American Students | Number of Black or African American Students |
|---|---|---|
| Associate’s degrees | 27.7% | 121,610 |
| Bachelor’s degrees. | 45.5% | 199,960 |
| Master’s degrees. | 22.6% | 99,070 |
| Doctorate or professional degrees. | 4.2% | 18,490 |
- The number of Hispanic or Latino college graduates is 709,240, accounting for 17.3% of the total college graduates.
Here is a table displaying the number of Hispanic or Latino students who graduate with different degrees.
| Graduation Degree | Percentage of Hispanic or Latino Students Graduating | Number of Hispanic or Latino Students | Percentage of Degrees |
|---|---|---|---|
| Associate’s degrees | 37.3% | 264,300 | 26.2% |
| Bachelor’s degrees. | 46.0% | 325,930 | 16.2% |
| Master’s degrees. | 14.3% | 101,340 | 11.5% |
| Doctorate or professional degrees. | 2.5% | 17,660 | 8.7% |
- The number of White or Caucasian students that graduate from college is 2,201,020.
It accounts for 53.6% of college graduates.
The following table depicts the number of White or Caucasian students who graduate from college with different degrees.
| Graduation Degree | Percentage of White or Caucasian Students Graduating | Number of White or Caucasian Students | Percentage of Degrees |
|---|---|---|---|
| Associate’s degrees | 22.2% | 488,070 | 48.4% |
| Bachelor’s degrees. | 51.3% | 1.13 million | 56.1% |
| Master’s degrees. | 21.4% | 470,780 | 53.5% |
| Doctorate or professional degrees. | 5.1% | 112,600 | 55.2% |
- 3.7% of college graduates are of two or more races. It equals 152,890 students.
The following table shows the number of college graduates that belong to two or more races.
| Graduation Degree | Percentage of Two or More Races of Students Graduating | Number of Two or More Races Students | Percentage of Degrees |
|---|---|---|---|
| Associate’s degrees | 26.2% | 40,040 | 4.0% |
| Bachelor’s degrees. | 53.4% | 81,660 | 4.1% |
| Master’s degrees. | 16.3% | 24,970 | 2.8% |
| Doctorate or professional degrees. | 4.1% | 6,220 | 3.1% |
- 6.2% of college graduates are reported to be nonresidents. They account for 254,490 college graduate students.
The following table displays the percentage of nonresident students who graduate from college.
| Graduation Degree | Percentage of Nonresident Students Graduating | The Number of Nonresident Students | Percentage of Nonresident Students out of Total Students |
|---|---|---|---|
| Associate’s degrees | 7.3% | 18,520 | 1.8% |
| Bachelor’s degrees. | 37.1% | 94,400 | 4.7% |
| Master’s degrees. | 45.7% | 116,220 | 13.2% |
| Doctorate or professional degrees. | 10.0% | 25,340 | 12.4% |
Source: Education Data, NCES
College Graduation Rates By Major
- 16.9% of the students earn graduate degrees in STEM subjects. This accounts for 692,630 students.
The following table displays the percentage and number of STEM students graduating with different degrees.
| Graduation Degree | Percentage of Stem students Graduating | Number of Stem Students |
|---|---|---|
| Associate’s degrees | 12.3% | 84,860 |
| Bachelor’s degrees. | 62.9% | 435,510 |
| Master’s degrees. | 20.2% | 139,940 |
| Doctorate or professional degrees. | 4.7% | 32,320 |
- 698,720 graduates are recorded to earn business degrees. It accounts for 17.0% of the total graduates.
The number of students graduating with different degrees in Business is as follows:
| Graduation Degree | Percentage of Business Students Graduating | Number of Business Students |
|---|---|---|
| Associate’s degrees | 16.2% | 113,070 |
| Bachelor’s degrees. | 53.7% | 375,420 |
| Master’s degrees. | 29.5% | 205,750 |
| Doctorate or professional degrees. | 0.64% | 4,490 |
- 16.5% of graduate students earn a healthcare degree. This equals 631,486 students.
Here is the number and percentage of students who graduate with different degrees in the healthcare field.
| Graduation Degree | Percentage of Healthcare Students Graduating | Number of Healthcare Students |
|---|---|---|
| Associate’s degrees | 26.2% | 177,410 |
| Bachelor’s degrees. | 39.0% | 263,770 |
| Master’s degrees. | 21.8% | 147,040 |
| Doctorate or professional degrees. | 13.0% | 87,750 |
- Liberal Arts and Sciences are preferred by 423,140 students to graduate.
This equals 10.3% of the students graduating in the field.
The following table displays the percentage of students graduating in Liberal Arts and Sciences.
| Graduation Degree | Number of Liberal Arts and Sciences Students Graduating | Percentage of Liberal Arts and Sciences Students |
|---|---|---|
| associates degrees | 383,290 | 90.6% |
| Bachelor’s degrees. | 37,890 | 9.0% |
| Master’s degrees. | 1,860 | 0.44% |
| Doctorate or professional degrees. | 110 | 0.03% |
- 6.7% of the total graduates earn a degree in education.
That’s equal to 274,450 students graduating in the field.
Let us take a look at the number of students who graduate with an education degree.
| Graduation Degree | Percentage of Education Students Graduating | Number of Education Students |
|---|---|---|
| Associate’s degrees | 6.7% | 18,500 |
| Bachelor’s degrees. | 32.6% | 89,410 |
| Master’s degrees. | 55.3% | 151,710 |
| Doctorate or professional degrees. | 5.4% | 14,840 |
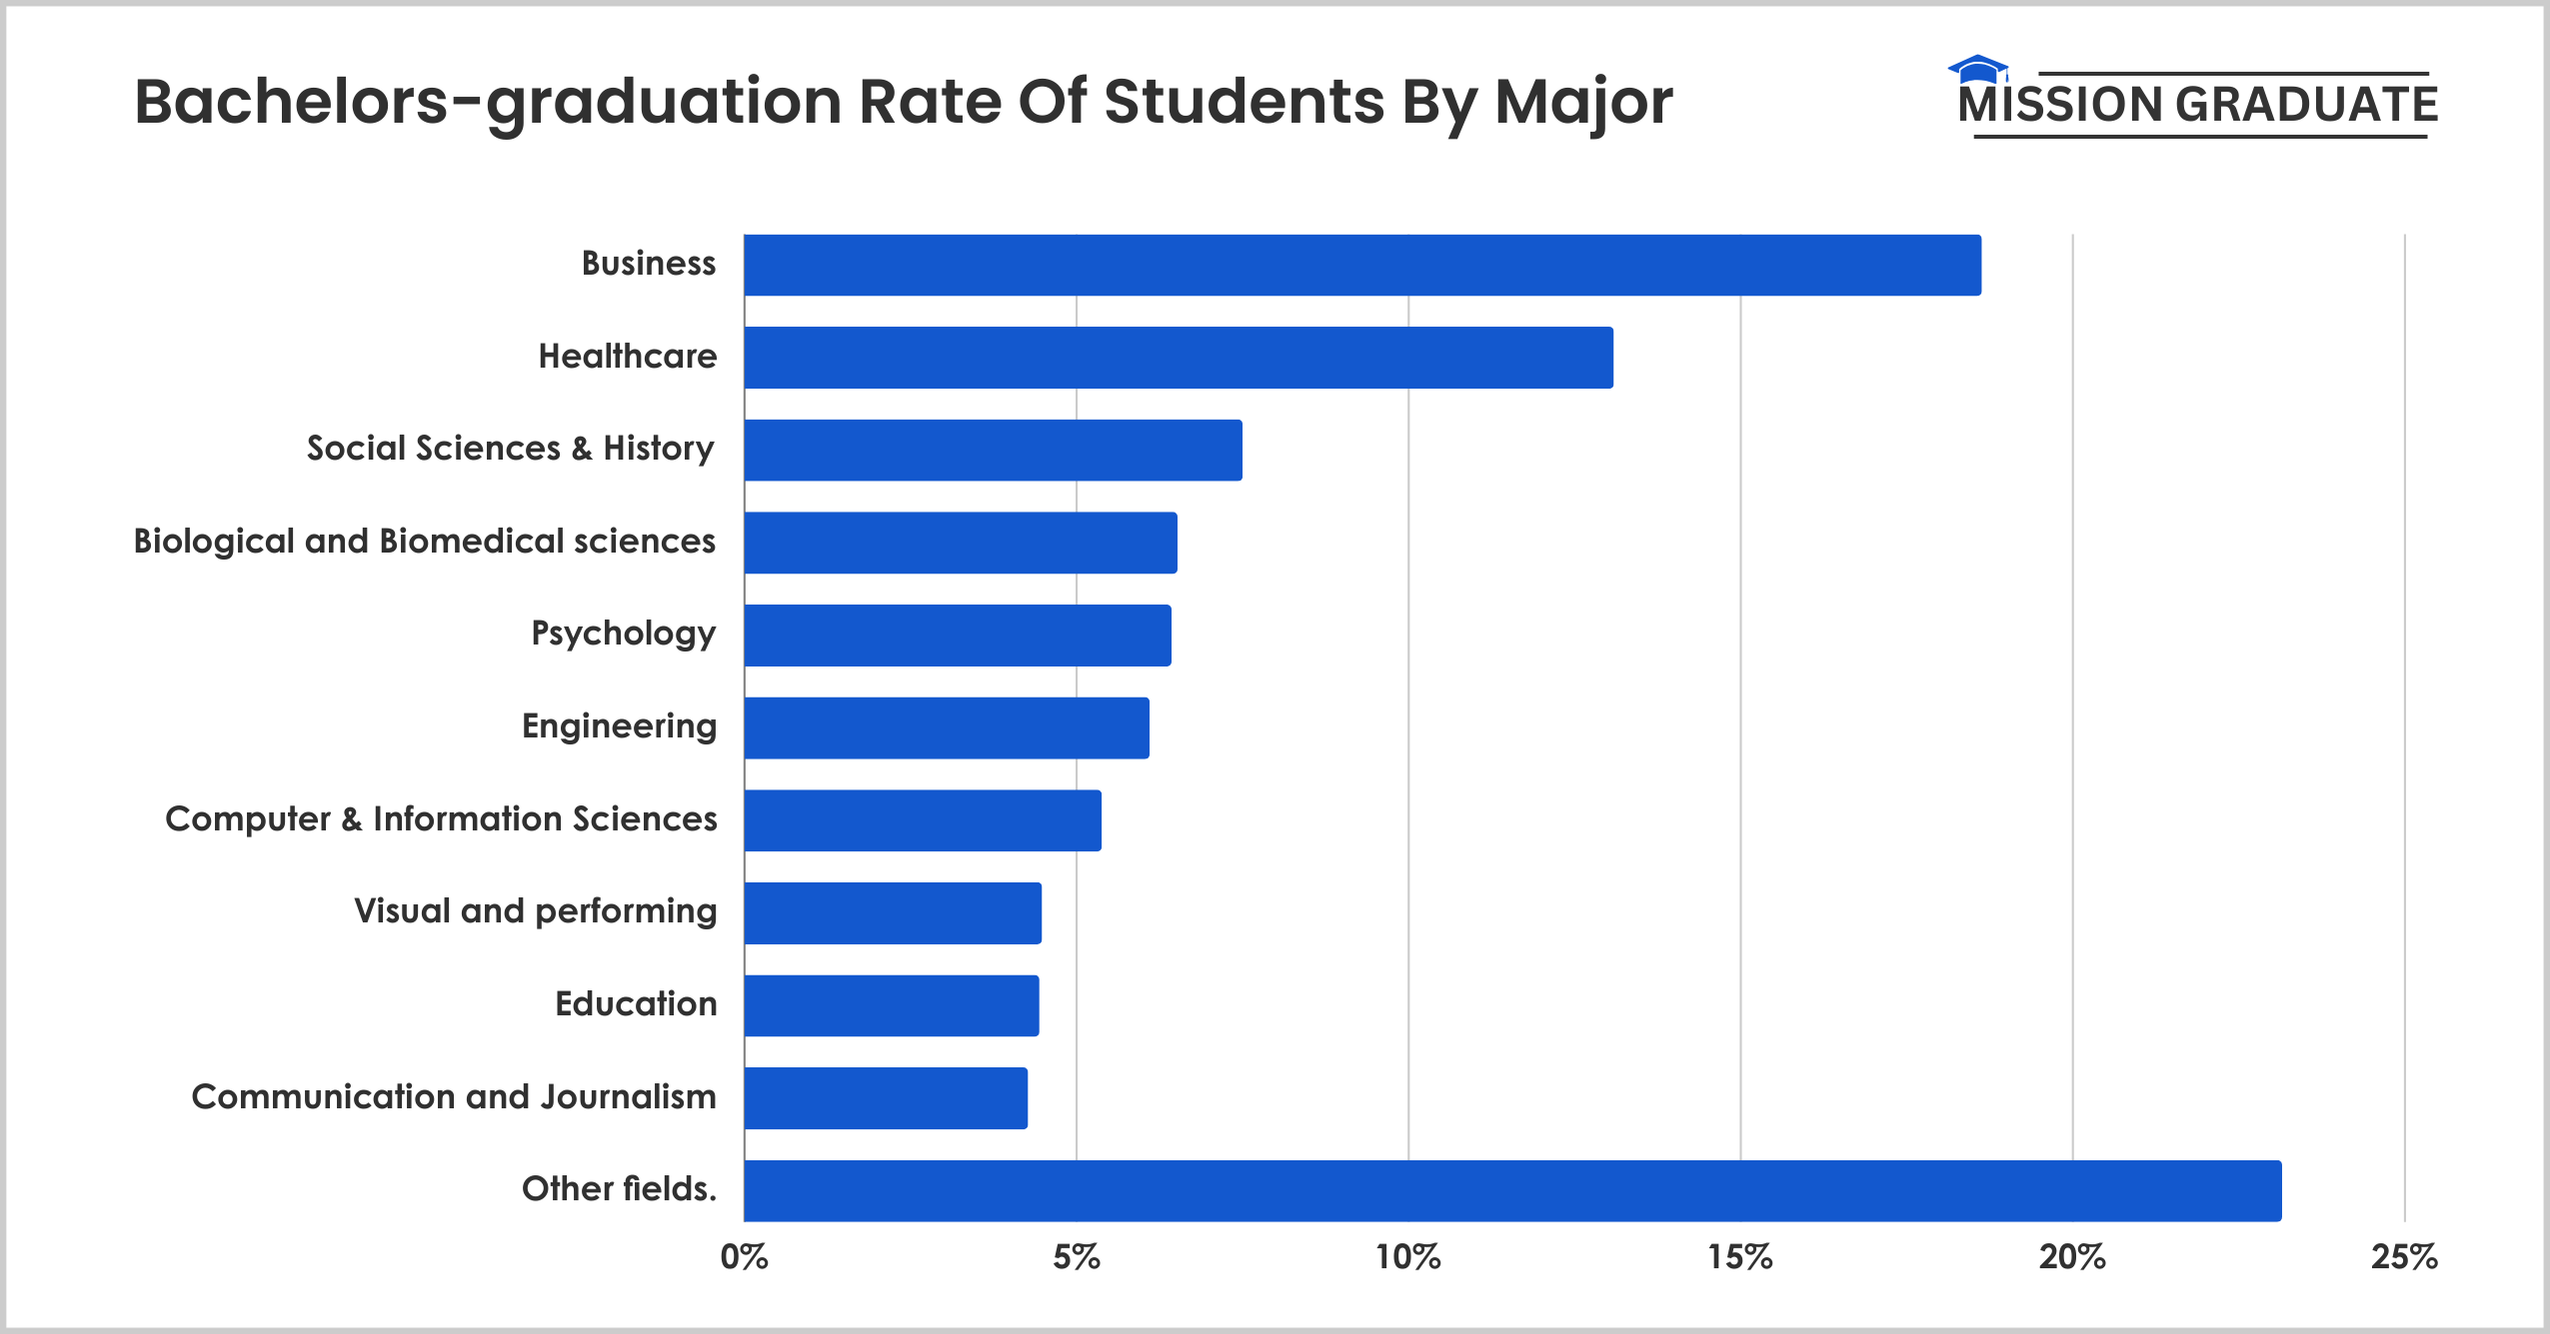
- 7.50% of the students earn a bachelor’s degree in Social science and history.
At the same time, 6.43% of students have a bachelor’s in psychology.
Besides, Businesses, Healthcare, Social Sciences & History are the most preferred majors by the students.
The following table displays the percentage of students earning bachelor’s degrees in different fields.
| Field of Bachelor’s Degree | Percentage of Students Graduating |
|---|---|
| Business | 18.63% |
| Healthcare | 13.09% |
| Social Sciences & History | 7.50% |
| Biological and Biomedical sciences | 6.52% |
| Psychology | 6.43% |
| Engineering | 6.10% |
| Computer & Information Sciences | 5.38% |
| Visual and performing | 4.48% |
| Education | 4.44% |
| Communication and Journalism | 4.27% |
| Other fields. | 23.15% |
Source: Education Data
College Graduation Statistics by State
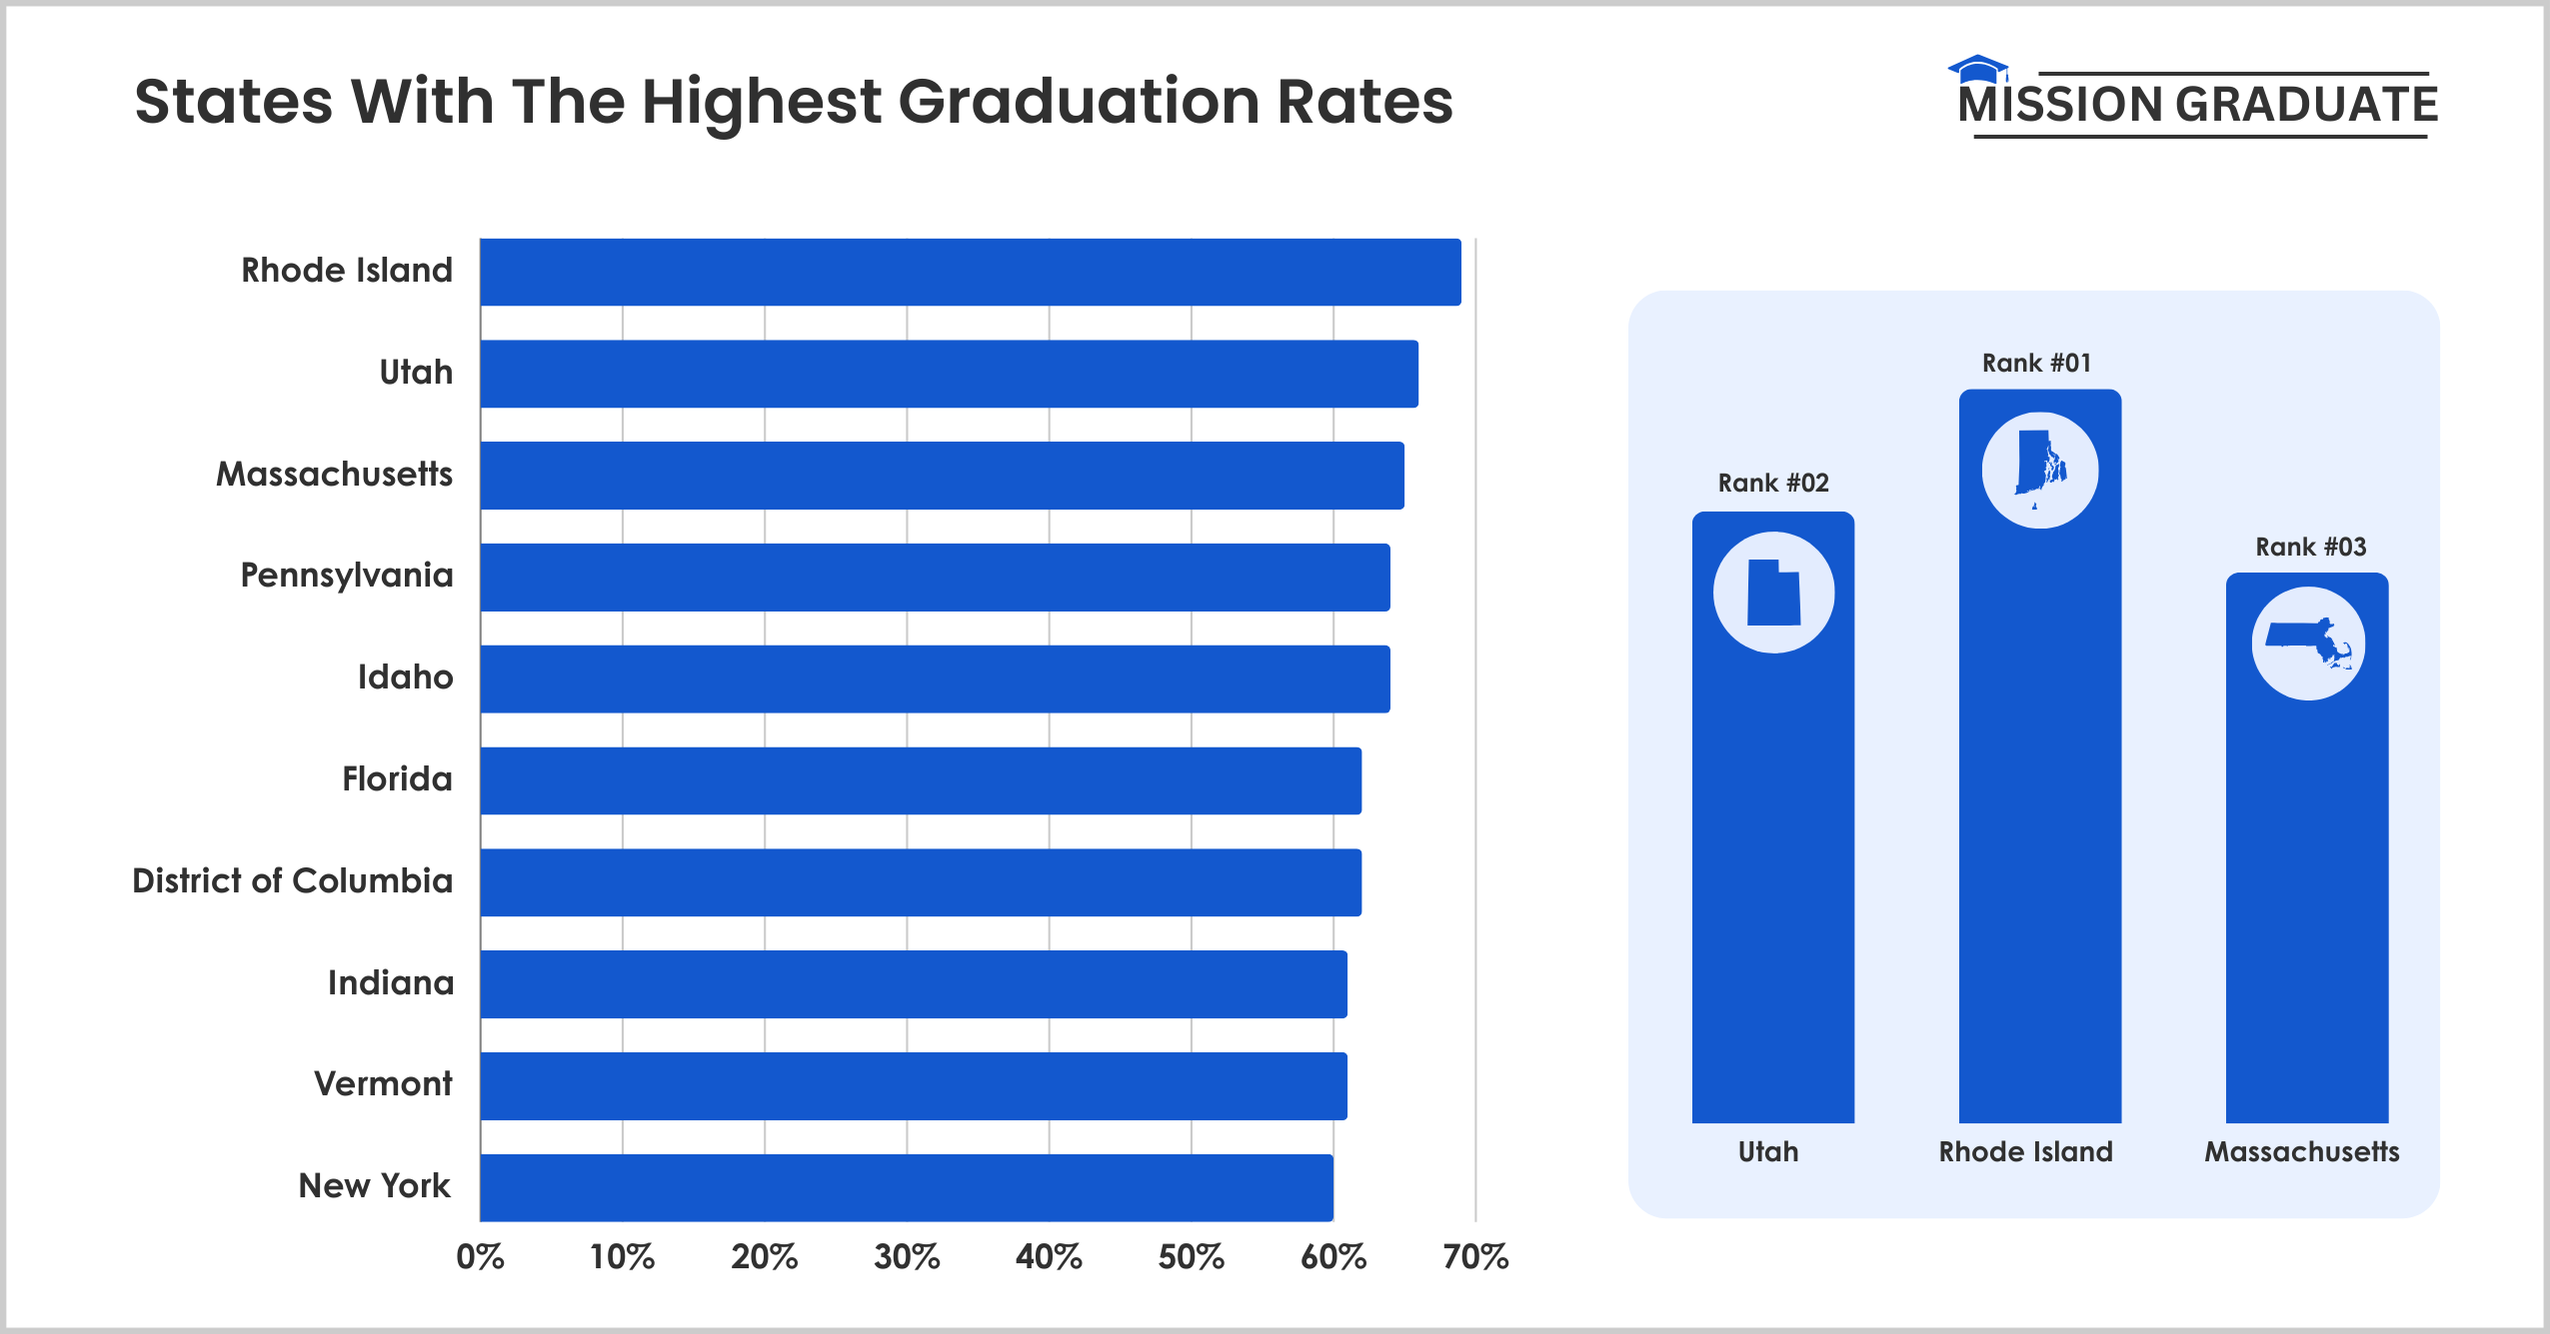
- Rhode Island has the highest college graduation rate in the United States, with 69% of the students graduating in 2022
At the same time, Utah has the second-highest graduation rate of 66% in the country.
Other states with high graduation rates in the United States are Massachusetts, Pennsylvania, and Idaho.
The following table displays the states with the highest graduation rates in the United States.
| Rank | Country | Graduation Rate |
|---|---|---|
| 1 | Rhode Island | 69% |
| 2 | Utah | 66% |
| 3 | Massachusetts | 65% |
| 4 | Pennsylvania | 64% |
| 5 | Idaho | 64% |
| 6 | Florida | 62% |
| 7 | District of Columbia | 62% |
| 8 | Indiana | 61% |
| 9 | Vermont | 61% |
| 10 | New York | 60% |
| 11 | New Hampshire | 60% |
- New Mexico has the lowest graduation rate in the United States at 38%.
At the same time, Alaska has the second lowest graduation rate in the country at 44%.
Alabama has the same graduation rate as Alaska, while other states with the lowest graduation rates in the country are Georgia, Hawaii, and Montana.
The following table displays the states with the lowest graduation rates in the United States as of 2022.
| Sr. No | State | Graduation Rate |
|---|---|---|
| 1 | New Mexico | 38% |
| 2 | Alaska | 44% |
| 3 | Alabama | 44% |
| 4 | Georgia | 46% |
| 5 | Hawaii | 46% |
| 6 | Montana | 47% |
| 7 | North Dakota | 47% |
| 8 | Wyoming | 48% |
| 9 | Arkansas | 48% |
| 10 | South Carolina | 48% |
| 11 | North Carolina | 49% |
Source: US department of education
Students Graduating With Loans Or Debts
- Nearly 44 million American students take loans for their education.
- 42% of the students earn a bachelor’s degree for their college with zero debts.
At the same time, 23% of the students graduate with loans less than $20,000.
The following table displays the percentage of students who graduate from colleges with different amounts of loans.
| Percentage of College Graduate Students | Amount |
|---|---|
| 42% | $0 |
| 23% | $1–$19,999 |
| 13% | $20,000–$29,999 |
| 15% | $30,000–$49,999 |
| 7% | $50,000+ |
Source: Association of Public and Land-Grant Universities
Employment Rates Of College Graduates
- In October 2023, 70.2% of college graduate students were employed.
Among the recent bachelor graduate students, 75.2% of the men were employed, while 66.8% of the women were employed.
Besides, In October 2023, 84.5% of the students aged 20 to 29 with a master’s, professional, or doctoral degree were employed.
Further, 61.0% of the students with an associate’s degree aged 20 to 29 were employed as of October 2023.
- In 2023, the employment rate for 25- to 34-year-olds with a bachelor’s degree was 88%.
That is a 1 percentage point increase in the employment rate of the students with bachelor’s degrees in the country compared to the 87% of the employment rate recorded in 2022.
At the same time, three-fourths of the students who have graduated high school are employed.
The following table displays the graduation rate of the students who have completed different degrees.
| Year | Less than high school completion | High school completion | Some college, no bachelor’s degree | Bachelor’s or higher degree |
|---|---|---|---|---|
| 2023 | 60% | 74% | 80% | 88% |
| 2022 | 61% | 73% | 79 % | 87% |
| 2021 | 53% | 68% | 75% | 86% |
| 2020 | 57% | 69% | 78% | 86% |
| 2019 | 57% | 74% | 80 % | 87% |
| 2018 | 59% | 72% | 79% | 86% |
| 2017 | 57% | 72% | 80% | 86% |
| 2016 | 59% | 70% | 77% | 86% |
| 2015 | 57% | 70% | 76% | 85% |
| 2014 | 58% | 68% | 74% | 84% |
| 2013 | 57% | 68% | 75% | 84% |
Source: US Bureau of Labour Statistics, NCES
Conclusion: College Graduation Rate Grew By 2.2%
In 2023, the college graduation rate reached 62.2%, an increase of 2.2 percentage points compared to that recorded between 2008 and 2021.
Hence, after observing the increase in college graduation rates over the past years, it is evident that the number of college graduation rates will increase in the upcoming decade.
The trends also show that the number of male students graduating in a year is estimated to remain low compared to the number of female students. On the other hand, Asian students have the highest graduation rates among other races.
That’s all about college graduation. Here are some related reads you can check out:

