Scholarships are a reliable source for students to pay their college tuition and get recognized for their efforts.
More than 1.7 million scholarships are offered yearly, and funds worth $46 billion are distributed across the U.S. yearly.
The federal government provides the majority of scholarships, and a small percentage of them come from private donors.
This article covers the statistical data about public, private, and athletic scholarships in the U.S.
Top College Scholarship Statistics (2024)
- Over 1.7 million scholarships are given out every year.
- First-time undergraduates receive about $14,890 from scholarships every year.
- 77.4% of men and 84.1% of women in the United States received scholarships in 2019-20.
- The U.S. government gives $46 billion in scholarships every year.
- 92.2% of Black students received scholarships in 2019-20
- Undergraduate students received an average Pell Grant of $4,597 in 2021-22
General College Scholarship Statistics: How Many People Get Scholarships?
College scholarships are a relief for students affected by increasing education costs. Multiple private and federal scholarships are available for students to apply for and benefit from.
This section will discuss statistics about scholarships in the United States.
More Than 1.7 Million Scholarships Are Awarded Every Year
Due to fierce competition and eligibility criteria, only about 7% of college students get awarded scholarships.
58% of U.S. families use scholarships to help pay for college, 16% of students receive state scholarships, and 13% receive private scholarships.
Source: Education Data, Search Logistics
First-Time Undergraduates Earning Government Grants And Scholarships At A Four-Year College Receive About $14,890 Per Year
4-year college students with a family income of $0 to $30,000 receive scholarships worth $16,050.
$17,110 is awarded to students with an average annual family income of $30,001 to $48,000 annually. This is the highest average scholarship aid received according to family income.
College students with a family income of $110,001 or more receive the lowest average annual scholarship aid of around $12,120.
The table below shows the average scholarship aid per student by family income:
| Income Level | Scholarship Aid Per Year |
|---|---|
| All income levels | $14,890 |
| $0 to $30,000 | $16,050 |
| $30,001 to $48,000 | $17,110 |
| $48,001 to $75,000 | $15,700 |
| $75,001 to $110,000 | $13,510 |
| $110,001 or more | $12,120 |
Source: Education Data
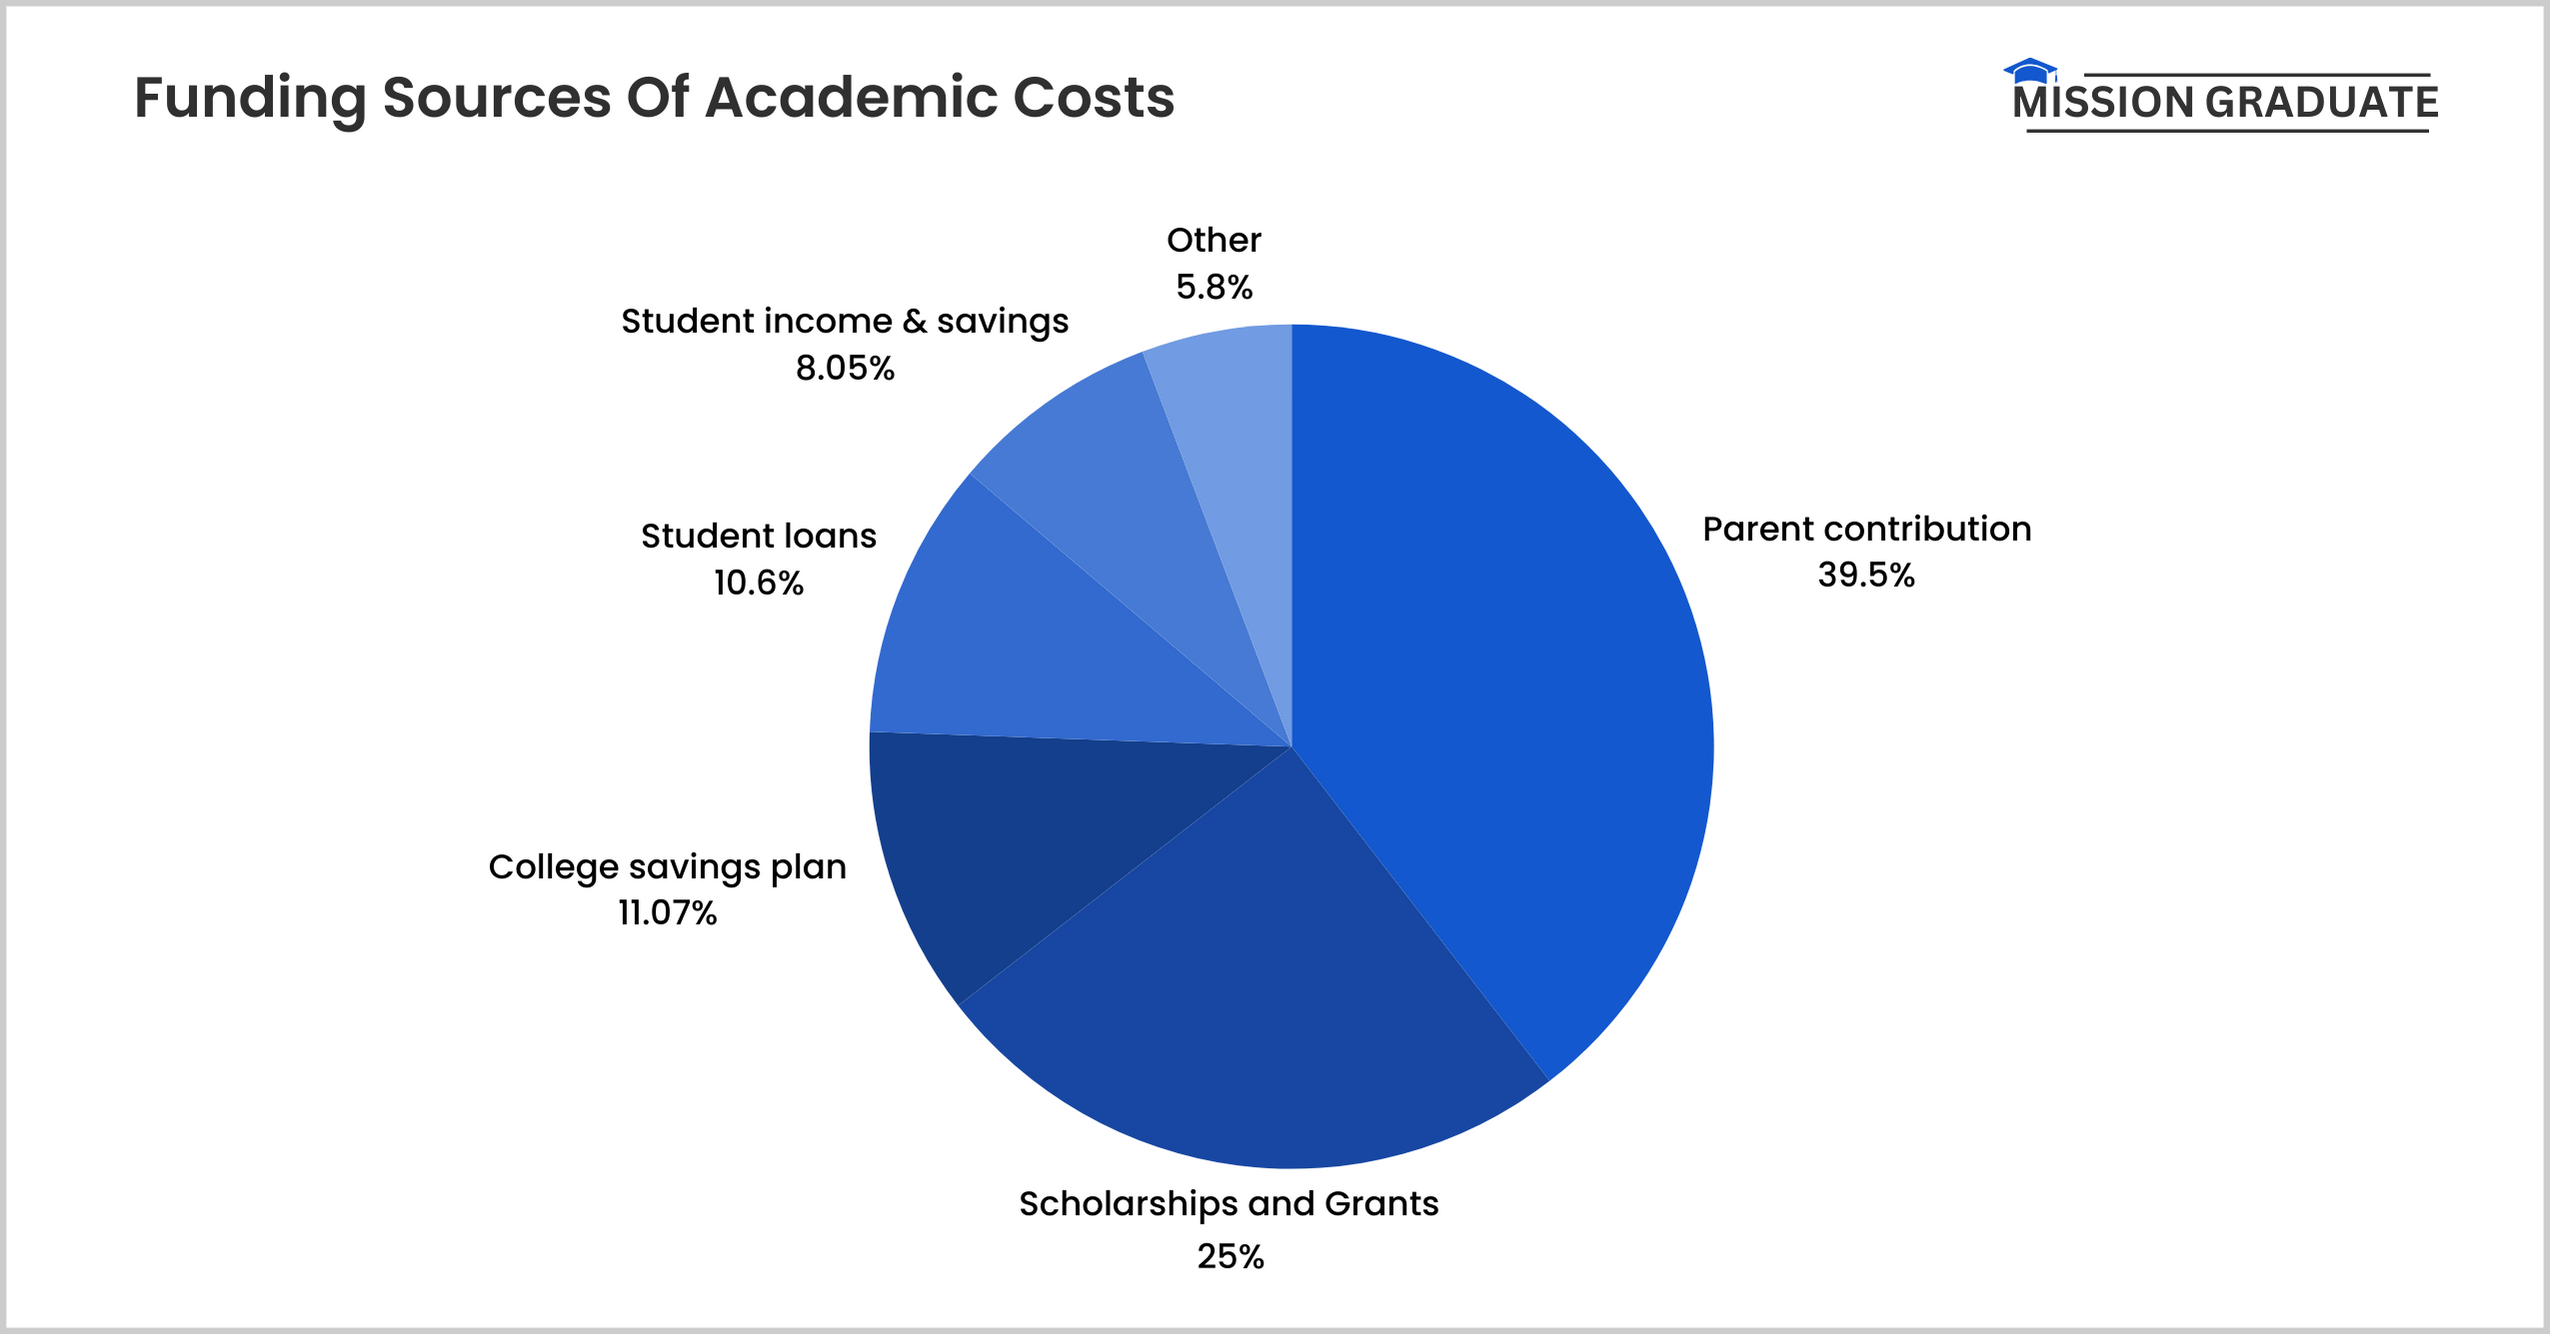
Scholarships And Grants Cover 24.95% Of Annual Academic Costs Per Student
39.54% of the annual academic costs are paid by parents of students, which represents the largest share.
The college savings plan covers 11.07% of educational costs, and student loans cover 10.64%.
Further, student income and savings cover 8.05% of academic costs, and other sources cover 5.74%.

Here is a breakdown of the annual academic costs of college students:
| Funding Source | Percentage of Share |
|---|---|
| Parent contribution | 39.54% |
| Scholarships and Grants | 24.95% |
| College savings plan | 11.07% |
| Student loans | 10.64% |
| Student income and savings | 8.05% |
| Other | 5.74% |
Source: Education Data
Health Students Received 18.4% Of The Total Scholarship Amount
This represents the largest percentage of the total amount of grant aid received by college majors.
With 16.3% of the total scholarship amount, the Humanities major students received the second most generous grant aid.
15.9% of scholarships went to students majoring in business or management, and 4.5% went to education majors.
The table below shows the distribution of total scholarship money by college major:
| Major | Total Amount of Scholarship Money Received |
|---|---|
| Health | 18.4% |
| Humanities | 16.3% |
| Business / Management | 15.9% |
| Technical / Professional | 12.3% |
| Life Sciences | 7.5% |
| Social / Behavioral sciences | 7% |
| Engineering | 6.1% |
| Computer / Information science | 4.6% |
| Education | 4.5% |
| Vocational / Technical | 3.2% |
| Physical sciences | 1.1% |
| Math | 0.6% |
Source: Cross River Therapy
College Scholarship Recipient Demographic Statistics
In this section, let us explore the age, gender, and ethnic demographics of college scholarship recipients in the U.S.
77.4% Of Males And 84.1% Of Females In The U.S. Received Scholarships In 2019-20
Further, 78.2% of non-binary students received scholarships in the U.S.
57.3% of males and 66.6% of females received federal scholarships, while 64.1% of males and 68.5% of females received non-federal scholarships in 2019-20.
The average scholarship aid received by males and females was around $22,180 and $21,850, respectively.
Source: NCES
82.9% Of Students Aged 24 To 29 Received Scholarships During 2019-20
About 80.9% of students aged between 15 and 23 received scholarships worth $22,880 annually.
81.9% of students aged 30 or over got scholarships amounting to $17,390 in 2019-20.
Moreover, students aged 24 to 29 received an average of $18,750 per year in scholarships.
Source: NCES
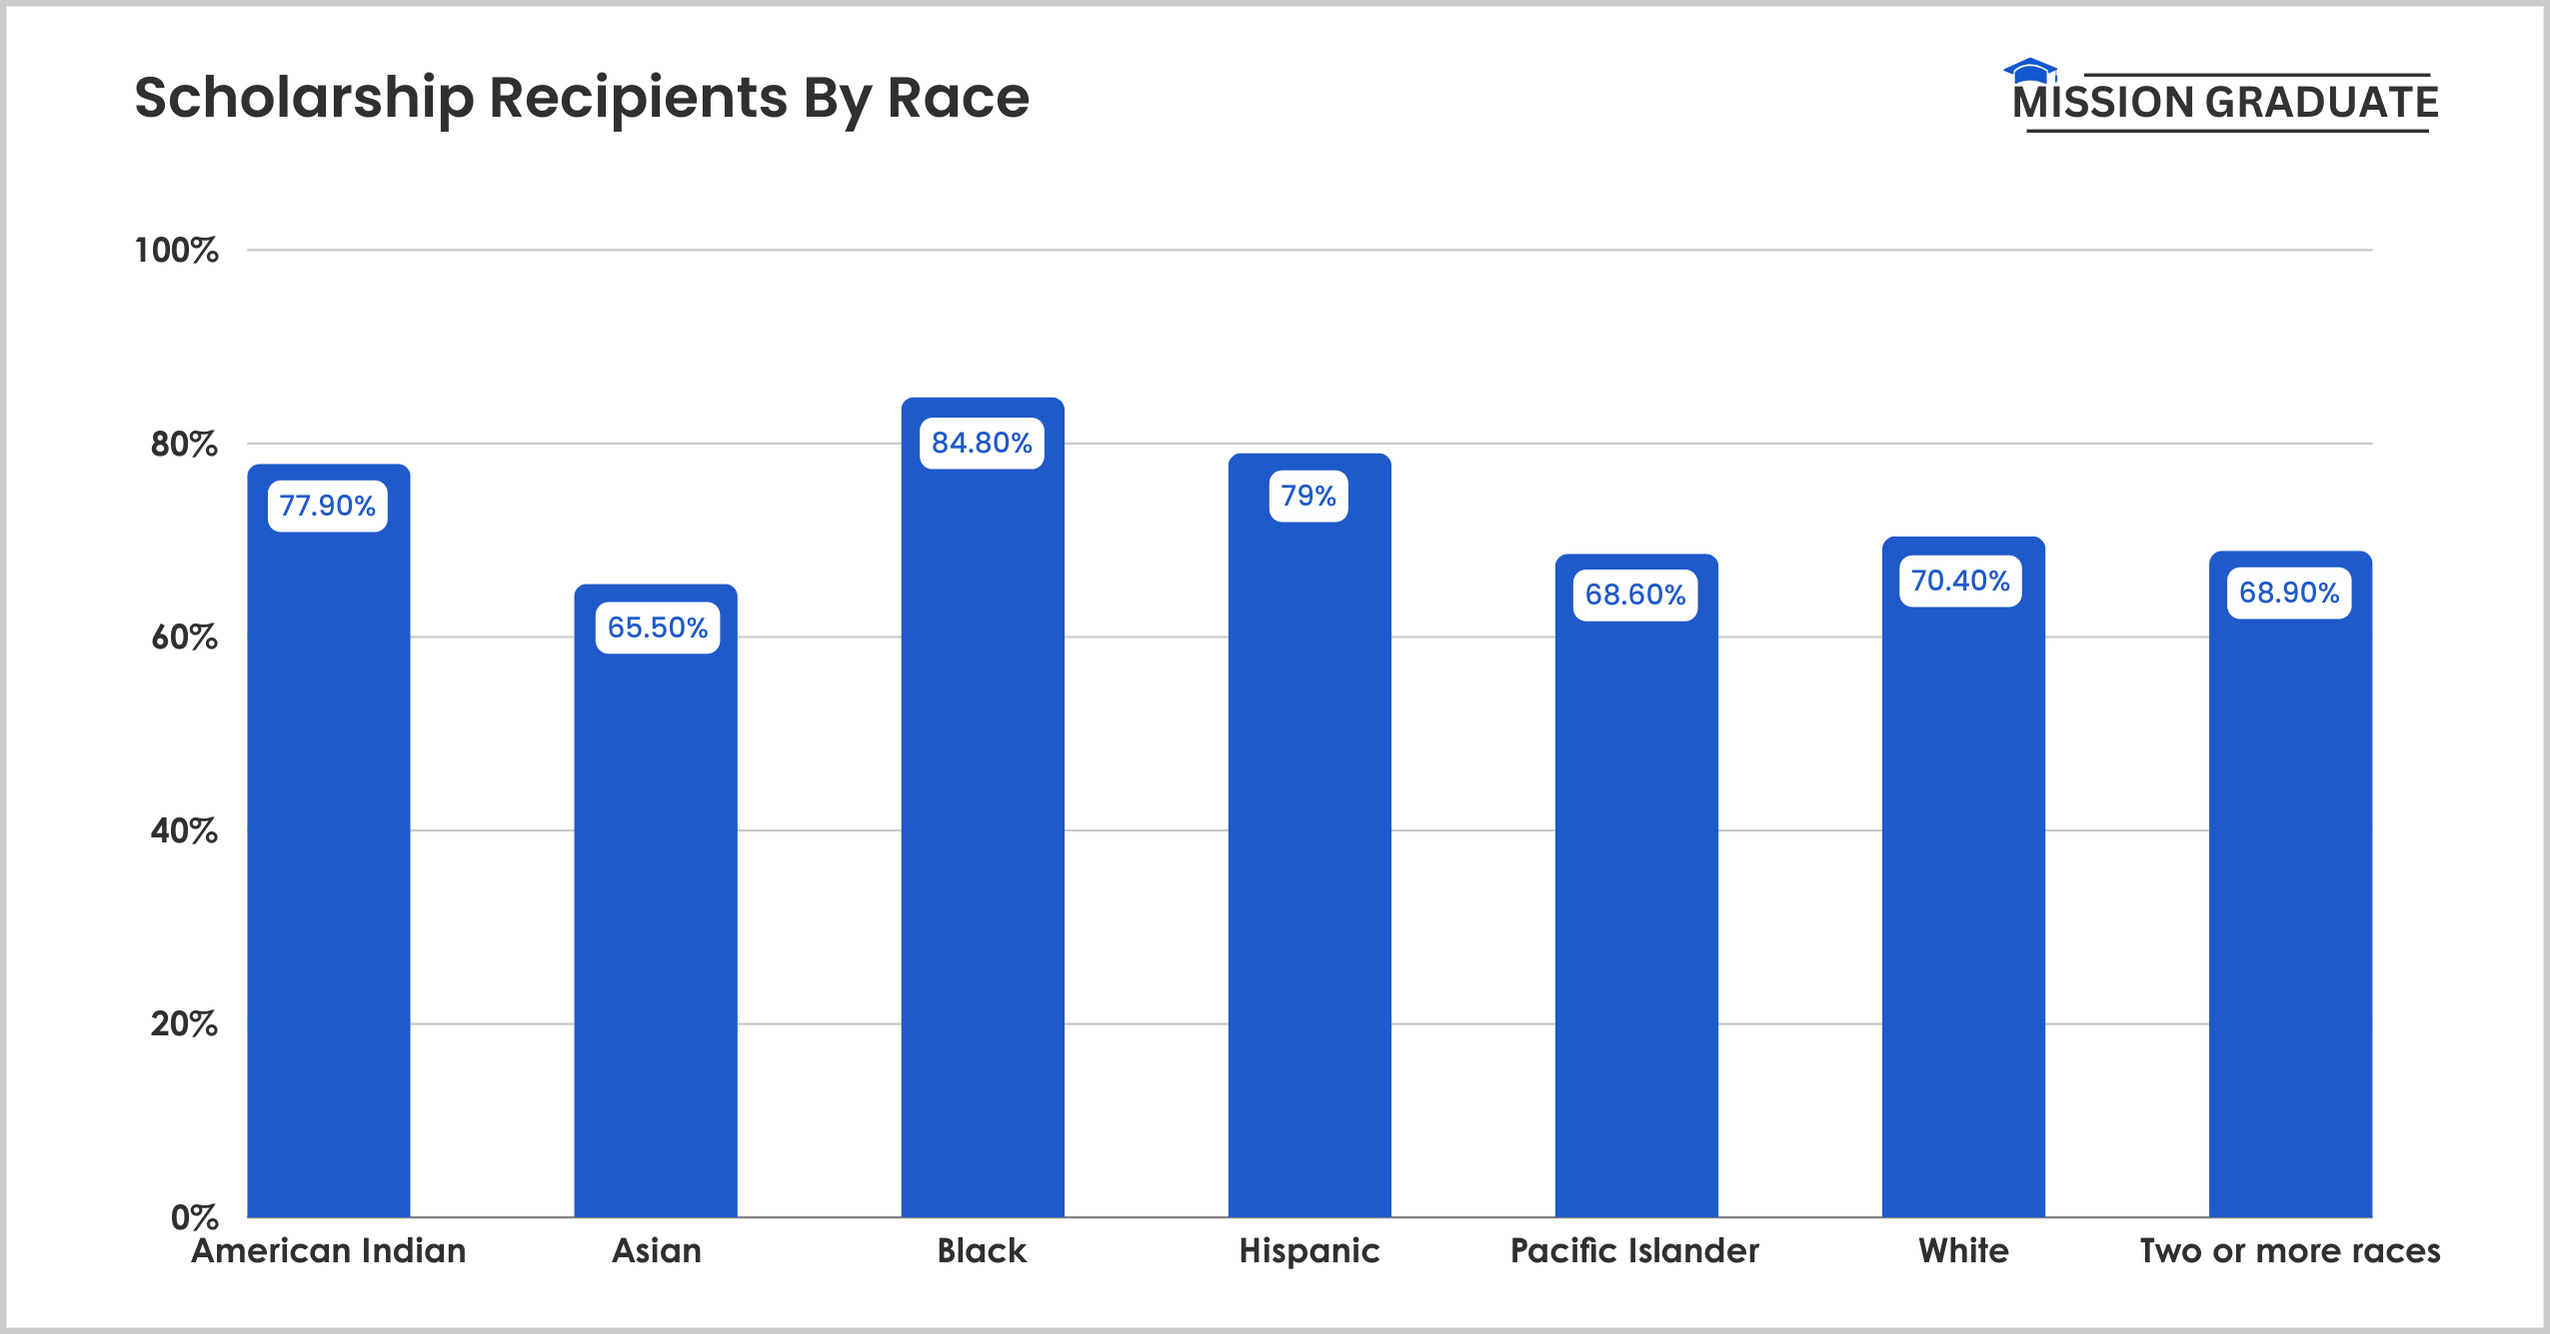
92.2% Of Black Students Received Scholarships In 2019-20
This represented the highest proportion of students receiving scholarships by race.
About 70.4% of White students received scholarships, and 79% of Hispanics received scholarships in the U.S.
On the other hand, 65.5% of Asians received an average of $18,670 per year in scholarships.

The table below shows the percentage of students receiving scholarships and the average amount received by different ethnic groups:
| Ethnicity | Percentage of Students | Average Amount Received |
|---|---|---|
| American Indian | 77.9% | $15,700 |
| Asian | 65.5% | $18,670 |
| Black | 84.8% | $15,070 |
| Hispanic | 79% | $14,730 |
| Pacific Islander | 68.6% | $10,270 |
| White | 70.4% | $14,390 |
| Two or more races | 68.9% | $16,020 |
Source: NCES
Public Scholarship Statistics
Public scholarships play a crucial role in providing financial help to students who wish to complete higher education but are restrained by their financial condition.
This section will discuss statistics about public scholarships.
The U.S. Department Of Education Gives Out An Estimated $46 Billion In Scholarship Money Every Year
First-time undergraduates, on average, receive government grants and scholarships at a 4-year college and receive approximately $13,690 every year.
Furthermore, about $3.3 billion in gift aid is offered privately by people, NGOs, religious organizations, and many other organizations.
Source: Debt.org, Cross River Therapy
Undergraduate Students Received An Average Pell Grant Of $4,597 In 2021-22
The Pell Grant stands out as the most impactful and widely utilized scholarship the United States government offers.
During 2020-21, the average amount of Pell grants for undergraduate students was 4,569. Compared to 2015-16, the average amount increased by nearly $500 in 2021.
The average amount of Pell grants for undergraduate students has increased gradually over the years.
Here is a table with the average amount of Pell grants for undergraduate students over the years:
| Year | Average Amount |
|---|---|
| 2021 – 2022 | $4,597 |
| 2020 – 2021 | $4,569 |
| 2019 – 2020 | $4,495 |
| 2018 – 2019` | $4,416 |
| 2017 – 2018 | $4,271 |
| 2016 – 2017 | $4,046 |
| 2015 – 2016 | $4,026 |
| 2014 – 2015 | $3,973 |
| 2013 – 2014 | $3,946 |
| 2012 – 2013 | $3,884 |
| 2011 – 2012 | $3,861 |
| 2010 – 2011 | $4,057 |
Source: NCES
Males Received An Average Of $5,620, And Females Received $5,850 From Pell Scholarships In 2019-20
68.6% of males and 76.1% of females received grants during 2019-2020.
70.3% of non-binary receiving scholarships got an average of $5,440 per year.
In comparison, male students received $5,460, and female students received an average of $5,600 during 2015 – 2016.
The table below shows the average amount received by male and female students from Pell scholarships over the years:
| Year | Funds Received by Males | Funds Received by Females |
|---|---|---|
| 2019 – 2020 | $5,620 | $5,850 |
| 2015 – 2016 | $5,460 | $5,600 |
| 2011 – 2012 | $5,450 | $5,500 |
| 2007 – 2008 | $4,280 | $4,360 |
| 2003 – 2004 | $4,510 | $4,680 |
| 1999 – 2000 | $3,730 | $3,860 |
Source: NCES
64.3% of Black Students Received Pell Grant Scholarship In 2019 – 20
In contrast, 29.1% of White students received Pell Grant scholarships.
54.3% of Hispanic students reported receiving a Pell Grant of $6,130 during 2019 – 2020.
32.8% of Pell Grant recipients were Asian and got an average of $5,970 in scholarships.
Here is a table with Pell Grant recipients by race and amount received:
| Race | Percentage of Students | Amount Received |
|---|---|---|
| American Indian | 48.6% | $5,870 |
| Asian | 32.8% | $5,970 |
| Black | 64.3% | $6,130 |
| Hispanic | 54.3% | $5,920 |
| Pacific Islander | 39.2% | $5,920 |
| White | 29.1% | $5,460 |
| Two or more races | 36.7% | $5,640 |
Source: NCES
56.7% Of Students Aged Between 24 And 29 Years Received Pell Grant In 2019 – 2020
In addition, they received an average amount of $5,940 from the public grant.
50.6% of Pell Grant receivers were aged 30 or older and received an average amount of $6,030.
35% of students aged 15 to 23 years got $5,680 from the Pell Grant scholarship.
Here is a table with Pell Grant recipients by age and amount received:
| Age Group | Percentage of Recipients | Amount Received |
|---|---|---|
| 15 to 23 | 35% | $5,680 |
| 24 to 29 | 56.7% | $5,940 |
| 30 or over | 50.6% | $6,030 |
Source: NCES
Private Scholarship Statistics
Apart from the government scholarship schemes, many private organizations also offer scholarships to college students in the U.S.
This section will cover some statistics about private scholarships in the United States.
Private Organizations Offer More Than $7.4 Billion In Scholarship Money Every Year
But just one in eight college students receive a private scholarship.
73% of private scholarships were given to dependent students, while 27% to independent students.
Source: CNBC, Cross River Therapy
Students With A 3.5 Or Higher GPA Have A 17% Higher Chance Of Receiving Private Scholarships
On the other hand, students with a GPA between 3.0 and 3.4 are 13.1% more likely to receive private scholarships.
10.4% of students with a GPA score of 2.5 to 2.9 get private scholarships compared to 8.3% of students with a 2.0 to 2.4 GPA.
The table below shows the likelihood of getting a private scholarship by GPA score:
| GPA | Chances of Getting a Private Scholarship |
|---|---|
| 3.5 or higher | 17% |
| 3.0 to 3.4 | 13.1% |
| 2.5 to 2.9 | 10.4% |
| 2.0 to 2.4 | 8.3% |
| Less than 2.0 | 7% |
Source: Saving For College
The Miss America Foundation Offers Up To $12,000 In Private Scholarships Per Student
In contrast, the Coca-Cola Scholars Foundation offers a maximum of $20,000 in private scholarships.
The Society of Women Engineers (SWE) gave out 230 scholarships, which amounted to around $750,000 in total.
The United Negro College Fund offers money for over 400 different scholarships in the U.S.
Source: Education Data
71% Of Students From The Private Nonprofit 4-Year Institute Received Private Scholarships In 2015-16
35.1% of public 2-year college students received private scholarships, and 57.1% of students from public 4-year colleges received private scholarships.
43.8% of Private for-profit 2-year or more institutes students received non-federal scholarships, and 24.8% of private for-profit less-than-2-year received private scholarships.
Source: NCES
Athletic Scholarships
There are around 177,559 athletic-based scholarships, and over 180,000 students receive an athletic scholarship every year.
Based on division ranking, Division I, and Division II scholarships comprise $2.7 billion per year.
Male Basketball Players Were Awarded $38,246, While Female Players Received $36,758 In Athletic Scholarships
Meanwhile, some sports have scholarships for only one gender.
A male student playing baseball received an average of $13,220 as a scholarship.
A female tennis player receives $32,630, and a male player receives $18,379 in scholarships.
The table below shows the athletic scholarship amount received by gender:
| Sport | Male’s Average Scholarship Amount | Female’s Average Scholarship Amount |
|---|---|---|
| Ice Hockey | $31,756 | $41,172 |
| Soccer | $15,008 | $17,766 |
| Basketball | $38,246 | $36,758 |
| Golf | $12,066 | $21,866 |
| Skiing | $20,275 | $19,084 |
| Swimming and Diving | $16,695 | $18,794 |
| Tennis | $18,379 | $32,630 |
| Gymnastics | $18,191 | $40,172 |
| Lacrosse | $12,303 | $12,884 |
| Track and Field | $11,260 | $14,574 |
| Baseball | $13,220 | – |
| Football – FBS | $36,070 | – |
| Football – FCS | $20,706 | – |
| Wrestling | $12,551 | – |
| Volleyball | – | $31,138 |
| Softball | – | $20,715 |
Source: Education Data
Approximately 177,559 Scholarships Are Offered Across All Athletic Divisions
The NCAA Division 1 offers 74,243 scholarships to over 139,063 athletes in around 350 schools.
Division 2 awards 36,343 athlete scholarships among 85,385 athletes across 310 schools. Division 3 has the most athletes but does not receive any scholarships.
NAIA has 260 schools, and 56,354 athletes have access to around 25,778 athlete scholarships.
Here is a table showing the number of athlete scholarships offered by athletic associations in the U.S.
| Athletic Association | Number of Schools | Number of Athletes | Maximum Number of Scholarships |
|---|---|---|---|
| NCAA Division 1 | 350 | 139,063 | 74,243 |
| NCAA Division 2 | 310 | 85,385 | 36,343 |
| NCAA Division 3 | 438 | 144,062 | 0 |
| NAIA | 260 | 56,354 | 25,778 |
| NJCAA | 464 | 53,248 | 41,195 |
| Other | 276 | 39,737 | Not available |
| Total | 2,058 | 517,849 | 177,559 |
Source: NCSA
Male Football Athletes In The U.S. Were Offered Around 27,304 Scholarships
On the other hand, females in the United States received 16,620 athletic scholarships in Track and Cross Country Sports.
The highest number of scholarships for men were available in football, whereas women received the most scholarships in Track and Cross Country.
Women playing basketball received more (10,222) athletic scholarships than men (9,510)
Around 9,870 athletic scholarships were available for female soccer players and 6,368 were there for male soccer players.
Here is a table showing the number of athletic scholarships available in the United States by sport and gender during 2020-2021:
| Sport | Available Athletic Scholarships for Men | Available Athletic Scholarships for Women |
|---|---|---|
| Football | 27,304 | – |
| Track & Cross Country | 12,721 | 16,620 |
| Soccer | 6,368 | 9,870 |
| Golf | 3,035 | 3,544 |
| Tennis | 2,357 | 4,362 |
| Swimming | 2,252 | 3,924 |
| Volleyball | 702 | 8,176 |
| Ice Hockey | 1,193 | 756 |
| Lacrosse | 1,744 | 2,579 |
| Gymnastics | 88 | 768 |
| Softball | – | 7,657 |
| Field Hockey | – | 1,157 |
Source: Statista
NCAA’s Division 1 Football Bowl Subdivision Football Player Received Around $24,058 Through Scholarships
This was the highest average scholarship amount received by a college football player.
NCAA’s Division 1 FCS football players got about $13,769 from football scholarships in 2022.
NAIA football players received an average of $8,433 from the athletic scholarships.
The table below shows the average value of college football scholarships in the United States by division:
| Division | Average Value of Football Scholarships |
|---|---|
| NCAA 1 – FBS | 24,058 |
| NCAA 1 – FCS | 13,769 |
| NCAA 2 | 5,838 |
| NAIA | 8,433 |
| NJCAA | 2,212 |
| Other | 1,437 |
Source: Statista
Related Read:
Conclusion: College Scholarships In The U.S. Are Crucial, Aiding 1.7 million Students Annually!
Scholarships are lifesavers for students who plan to pursue higher education but have financial constraints.
Nearly 1.7 million students receive scholarships, which help them cover almost a quarter of their academic expenses.
The frequency of availing scholarships is increasing year over year, and more students are looking to grab scholarships in 2025.
These were some of the essential statistics regarding college scholarship statistics in the U.S.

